
12 Rules for Trading In Stocks
Over 45 years of practical experience in trying and testing rules have proven to me what is required for your success: you must do your part, learn the rules and put them into execution

Trader & investor, this is surely one of the most important articles ever written by Dax Trading Ideas. Not because it was written by us but it is part of the collection of fundamental rules that W.D. Gann left us. In case you missed first part with the 24 rules, we suggest you read our «24 Never-Failing Rules». In this article we have transcribed, translated and simplified Gann's 12 rules that are the basis of his success in the world of finance and investment. These rules have permanently changed the way we approach trading and guaranteed incredible results for thousands of investors around the world. The rules are based on a set of immutable principles because human nature doesn’t change, nor do the cycles of time. I hope our outreach work is the light and the voice you've been expecting to hear. Let’s dig in.

Trader e investitore, questo è sicuramente uno degli articoli più importanti mai scritti di Dax Trading Ideas. Non perchè è stato scritto di nostro pugno bensì perchè fanno parte della collezione di regole fondamentali che W.D. Gann ci ha lasciato. Nel caso in cui ti fossi perso la prima parte con le 24 regole, ti consigliamo di rileggerti il nostro pezzo «24 Never-Failing Rules». In questo articolo abbiamo trascritto, tradotto e semplificato le 12 regole di Gann che sono alla base del suo successo nel mondo della finanza e degli investimenti. Queste regole hanno cambiato definitivamente il modo di approcciare al trading e garantito risultati incredibili a migliaia di investitori in tutto il mondo. Le regole si basano su una serie di principi immutabili perchè la natura umana non cambia, così come i cicli del tempo. Spero che il nostro lavoro di sensibilizzazione sia la luce e la voce che vi aspettavate di sentire. Entriamo nel vivo.
Foreword
To make a success in trading in stocks you must get the knowledge first; you must learn before you lose. Many traders go into the stock market without any knowledge and lose a large part of their capital before they learn that it is necessary to go through a period of preparation before they start trading. I’m giving you the benefit of more than 45 years of experience in the stock market and laying down rules which, if you learn and follow, will make you a success. The first thing for you to realize is that when you make a trade you can be wrong; then you must know what to do to correct your mistake. The way to do that is to limit your risk by placing a Stop Loss order 1, 2 or 3 points below the price at which you buy. Then if you are wrong you will automatically be sold out and will be in position to enter the market again when you have a definite indication. Don’t guess; make a trade on definite rules and according to definite indications based on the rules which I lay down; this will give you a better chance to make a success.
Gann talked about 1, 2, 3 points because prices were very low. We can bring this concept back to current times by talking about 1, 2 or 3% or 100, 200, 300 points.
Read all of the rules and examples in my books, «Truth of the Stock Tape», «Wall Street Stock Selector» and «New Stock Trend Detector», and study 12 and 24 rules which are bound with this book «45 Years in Wall Street». The rules are good and will benefit if you study them. Remember that you can never learn too much. Always be ready and willing to learn something new; never have a fixed ideas that you know it all. If you do, you will not make any more progress. Time and conditions change and you must learn to change with them. Human nature doesn’t change and that is the reason history repeats and stocks act very much the same under certain conditions year after year and in the various cycles of time.

Premessa
Per avere successo nel trading è necessario innanzitutto acquisire le conoscenze necessarie; bisogna imparare prima di perdere. Molti trader entrano nel mercato azionario senza alcuna conoscenza e perdono gran parte del loro capitale prima di imparare che è necessario un periodo di preparazione prima di iniziare a fare trading. Vi metto a disposizione il vantaggio di oltre 45 anni di esperienza nel mercato azionario e stabilisco delle regole che, se imparate e seguite, vi porteranno al successo. La prima cosa che dovete capire è che quando fate un'operazione potete sbagliare; allora dovete sapere cosa fare per correggere il vostro errore. Il modo per farlo è limitare il rischio piazzando un ordine di stop loss 1, 2 o 3 punti al di sotto del prezzo di acquisto. In questo modo, se vi sbagliate, sarete fuori dal mercato e in grado di entrare nuovamente quando avrete un'indicazione precisa. Non tirate a indovinare; fate un'operazione in base a regole precise e a indicazioni precise basate sulle regole che ho stabilito; questo vi darà maggiori possibilità di successo.
Gann parlava di 1, 2, 3 punti perchè le quotazioni erano molto basse. Possiamo riportare questo concetto nei tempi attuali parlando di 1, 2 o 3% oppure 100, 200, 300 punti.
Leggete tutte le regole e gli esempi contenuti nei miei libri «Truth of the Stock Tape», «Wall Street Stock Selector» e «New Stock Trend Detector», e studiate le 12 e 24 regole che sono allegate a questo libro «45 Years in Wall Street». Le regole sono valide e vi saranno utili se le studierete. Ricordate che non si impara mai troppo. Siate sempre pronti e disposti a imparare qualcosa di nuovo; non abbiate mai l'idea fissa di sapere tutto. Se lo fate, non farete più progressi. Il tempo e le condizioni cambiano e voi dovete imparare a cambiare con loro. La natura umana non cambia ed è per questo che la storia si ripete e le azioni si comportano in modo molto simile in determinate condizioni, anno dopo anno e nei vari cicli temporali.
Determining the Trend
Determine the trend of Dow-Jones 30 Industrial Averages or the 15 public utilities or the average on any group of stocks that you intend to trade in, then select the stock in the group in which you want to trade and see if its trend indications conform to the trend indicated by the averages. You should use 3-Day Chart for the averages and 9-Point Average Swing Chart and apply all of the rules for determining the right time to buy or sell.
RULE #1Determinare la tendenza
Determinate la tendenza del Dow-Jones 30 o delle 15 aziende di pubblica utilità o la media di qualsiasi gruppo di titoli che intendete negoziare, quindi selezionate il titolo del gruppo in cui volete operare e verificate se le sue indicazioni di tendenza sono conformi alla tendenza indicata dalle medie. Dovreste utilizzare il grafico a 3 giorni per le medie e il grafico di oscillazione della media a 9 punti e applicare tutte le regole per determinare il momento giusto per acquistare o vendere.
Buy at Single, Double and Triple Bottoms
Buy at Double and Triple Bottoms or on Single Bottoms when they are nearer previous Old Bottoms or Tops or resistance levels. Remember the rule: Tops or ceilings which are selling points become floors, supports or buying points after these tops have been crossed and market reacts to them, or sells slightly below them. Sell at or against Single, Double or Triple Tops and, remember, that after an Old Top is broken by several points and market rallies up to or near it again, it becomes a selling point. After you have made a trade, determine the proper and safe place to place a Stop Loss order, and give it to your broker immediately. If you don’t know where to place a Stop Loss order, don’t make the trade. Don’t overlook fact that the 4th time the averages or an individual stock reaches the same level it is not as safe to sell, because it nearly always goes through. Reverse this rule at the bottom. When stocks decline to the same level the 4th time in most cases it breaks the bottom and continues down.
The Meaning of Double Tops and Bottoms — A Double Top on the averages can be in a range of 3 to 5 points. However, most Double Tops form in a range of from 1 to 2 points except at great extremes. The same way at an extreme bottom. If there has been a previous bottom around this same level many years back, the Averages can decline 4 to 5 points below the previous bottom without indicating they are going lower, and this can become a Double or a Triple Bottom. Individual stocks usually make a Double Top in a 2 to 3 point range and sometimes within a 1 to 2 point range. The same at the bottom; they make a Double Bottom in a 2 to 3 point range and sometimes the range is only 1 to 2 points below the different bottoms. Stop Loss orders should be placed on individual stocks 1 to 3 points above Double and Triple Tops, depending upon how high stocks are selling. Stop Loss orders should be placed under Double and Triple Bottoms 1 to 3 points away. A Triple Top or Bottom occurs when the averages or an individual stock has reached the same level the 3rd time. This is often the safest place to buy or sell because the market moves away from a Triple Top or a Triple Bottom much faster.
RULE #2Acquistare su singoli, doppi e tripli minimi
Comprate sui doppi e tripli minimi o sui singoli minimi quando sono più vicini ai precedenti vecchi minimi o massimi o ai livelli di resistenza. Ricordate la regola: i massimi che sono punti di vendita diventano pavimenti, supporti o punti di acquisto dopo che questi massimi sono stati attraversati e il mercato reagisce ad essi, o vende leggermente al di sotto di essi. Vendete su o contro singoli, doppi o tripli massimi e ricordate che, dopo che un vecchio massimo è stato rotto di diversi punti e il mercato ha ripreso a raggiungerlo o ad avvicinarsi ad esso, diventa un punto di vendita. Dopo aver effettuato un'operazione, stabilite il punto giusto e sicuro in cui piazzare un ordine di stop loss e comunicatelo immediatamente al vostro broker. Se non sapete dove piazzare un ordine di Stop Loss, non fate l'operazione. Non trascurate il fatto che la quarta volta che le medie o un singolo titolo raggiungono lo stesso livello non è altrettanto sicuro vendere, perché quasi sempre viene superato. Utilizzate la stessa regola al ribasso. Quando i titoli scendono allo stesso livello per la quarta volta, nella maggior parte dei casi rompono il fondo e continuano a scendere.
Il significato di doppi massimi e minimi — Un doppio massimo sulle medie può essere compreso tra 3 e 5 punti. Tuttavia, la maggior parte dei doppi massimi si forma in un intervallo compreso tra 1 e 2 punti, ad eccezione di quelli estremi. Lo stesso vale per un fondo estremo. Se c'è stato un precedente minimo intorno a questo stesso livello molti anni fa, le medie possono scendere di 4 o 5 punti sotto il precedente minimo senza indicare che stanno scendendo, e questo può diventare un doppio o triplo minimo. I singoli titoli di solito fanno un doppio massimo in un intervallo di 2 o 3 punti e talvolta in un intervallo di 1 o 2 punti. Lo stesso vale per la parte inferiore: fanno un doppio minimo in un intervallo di 2 o 3 punti e a volte l'intervallo è solo di 1 o 2 punti sotto i diversi minimi. Gli ordini di stop loss dovrebbero essere piazzati sui singoli titoli da 1 a 3 punti al di sopra dei doppi e tripli massimi, a seconda del livello di vendita dei titoli. Gli ordini di stop loss dovrebbero essere piazzati sotto i doppi e tripli minimi a 1 o 3 punti di distanza. Un triplo massimo o minimo si verifica quando le medie o un singolo titolo hanno raggiunto lo stesso livello per la terza volta. Questo è spesso il punto più sicuro per acquistare o vendere perché il mercato si allontana molto più rapidamente da un triplo massimo o da un triplo minimo.
Buy and Sell on Percentages
Buy or sell on a 50% decline from any high level or a 50% advance from any low level so long as these reactions or rallies are with the main trend. You can use the percentage of individual stocks as well as percentage of the averages to determine resistance levels and buying and selling points. You can use 3 to 5%, next 10 to 12%, next 20 to 25%, 33 to 37%, 45 to 50%, 62 to 67%, 72 to 78% and 85 to 87%. The most important resistance levels are 50% and 100% and proportionate parts of 100%.
RULE #3Comprare e vendere in base alle percentuali
Acquistate o vendete su un calo del 50% da qualsiasi livello alto o su un avanzamento del 50% da qualsiasi livello basso, purché queste reazioni o rally siano in linea con la tendenza principale. Per determinare i livelli di resistenza e i punti di acquisto e vendita è possibile utilizzare le percentuali dei singoli titoli e le percentuali delle medie. Si può utilizzare il 3-5%, il 10-12%, il 20-25%, il 33-37%, il 45-50%, il 62-67%, il 72-78% e l'85-87%. I livelli di resistenza più importanti sono il 50% e il 100% e parti proporzionali del 100%.
Buy and Sell on 3 Weeks Advance or Decline
Buy on a 3 weeks’ reaction or decline in a Bull Market when the main trend is up, as this is the average reaction in a strong Bull Market. In a Bear Market sell on a rally of around 3 weeks after you know the trend is down. After a market advances or declines 30 days or more, next time period to watch for tops and bottoms is around 6 to 7 weeks which will be a buying or selling level, protected, of course, with Stop Loss orders according to resistance levels. After a market rallies or declines more than 45 to 49 days, next time period is around 60 to 65 days which is about the greatest average time that a Bear Market rallies or a Bull Market reacts.
RULE #4Comprare e vendere su un'avanzata o un declino di 3 settimane
Comprate su una reazione o un calo di 3 settimane in un mercato rialzista quando la tendenza principale è al rialzo, poiché questa è la reazione media in un mercato rialzista forte. In un mercato orso, vendete su un rally di circa 3 settimane dopo aver capito che la tendenza è al ribasso. Dopo che un mercato avanza o scende per 30 giorni o più, il periodo successivo da osservare per i top e i bottom è di circa 6-7 settimane, che sarà un livello di acquisto o di vendita, protetto, ovviamente, da ordini di stop loss in base ai livelli di resistenza. Dopo un rally o un declino di oltre 45-49 giorni, il periodo successivo è di circa 60-65 giorni, ovvero il tempo medio più lungo in cui un mercato orso si muove o un mercato rialzista reagisce.
Market Moves in Sections
Stock market campaigns move in 3 to 4 sections or waves. Never consider that the market has reached final top when it makes the first section in a move up, because if it is a real Bull Market it will run at least 3 Sections and possibly 4 before a final high is reached. In a Bear Market, or declining market, never consider the market as final bottom when it makes the first decline or section because it will run 3 and possibly 4 sections before the Bear campaign is over.
RULE #5Il mercato si muove in sezioni
Le campagne del mercato azionario si muovono in 3 o 4 sezioni o onde. Non considerate mai che il mercato abbia raggiunto il top finale quando fa la prima sezione in un movimento al rialzo, perché se si tratta di un vero mercato rialzista, si muoverà in almeno 3 sezioni e possibilmente in 4 prima di raggiungere un massimo finale. In un mercato orso, o in declino, non considerate mai che il mercato abbia toccato il fondo quando fa il primo ribasso o la prima sezione, perché percorrerà 3 e forse 4 sezioni prima che la campagna orso sia finita.
Buy or Sell on 5 to 7 Point Moves
Buy or sell individual stocks on reactions of 5 to 7 points. When market is strong, reactions will run 5 to 7 points but will not decline as much as 9 to 10 points. By studying the Industrial Averages you will see how often a rally or reaction runs less than 10 points. However, it is important to watch 10 to 12 point rallies or declines for buying or selling levels on the average. The next important point to watch is 18 to 21 points up or down from any important Top or Bottom. Reactions of this kind in the averages often indicate the end of a move. When to Take Profits: after you have bought stocks or sold them, the next thing you need to know is when to take profit. Follow the rules and don’t take profits until there is a definite indication of a change in trend.
RULE #6Comprare o vendere su movimenti da 5 a 7 punti
Comprate o vendete i singoli titoli sulle reazioni da 5 a 7 punti. Quando il mercato è forte, le reazioni saranno di 5-7 punti, ma non scenderanno fino a 9-10 punti. Studiando le medie industriali si può notare quanto spesso un rally o una reazione sia inferiore a 10 punti. Tuttavia, è importante osservare i rally o i ribassi da 10 a 12 punti per individuare i livelli di acquisto o di vendita sulla media. Il prossimo punto importante da tenere d'occhio è quello dei 18-21 punti di rialzo o di ribasso da qualsiasi massimo o minimo importante. Reazioni di questo tipo nelle medie indicano spesso la fine di un movimento. Quando prendere profitto: dopo aver acquistato o venduto azioni, la cosa successiva da sapere è quando prendere profitto. Seguite le regole e non prendete profitto finché non c'è un'indicazione precisa di un cambiamento di tendenza.
Volume of Sales
Study the total volume of sales on the New York Stock Exchange in connection with time periods and study the rules under volume of sales. Study the volume of sales on individual stocks based on the rules given, as the volume of sales will help in determining when the trend is changing.
RULE #7Volume delle vendite
Studiate il volume totale delle vendite alla Borsa di New York in relazione ai periodi di tempo e studiate le regole sul volume delle vendite. Studiate il volume delle vendite dei singoli titoli in base alle regole indicate, poiché il volume delle vendite vi aiuterà a determinare quando la tendenza sta cambiando.
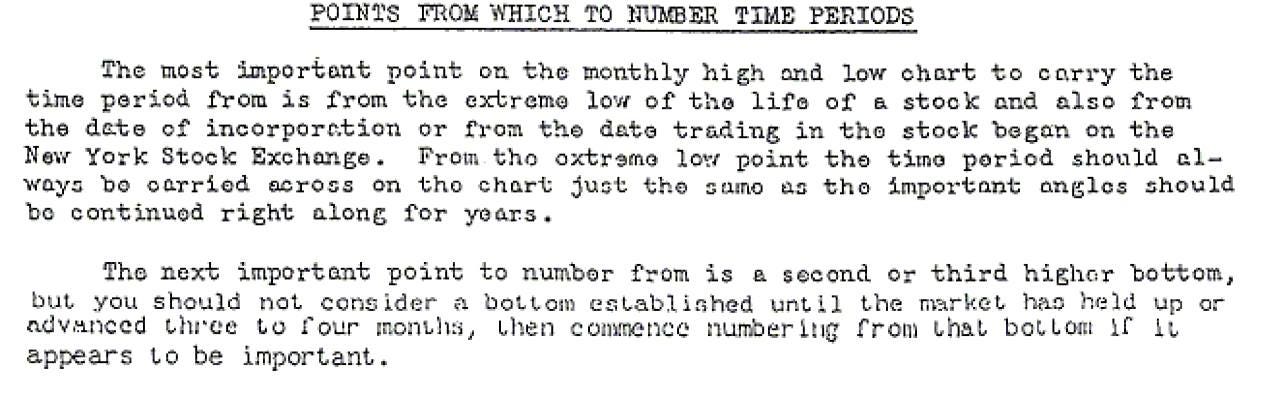
Time Periods
Time factor and time periods are most important in determining a change in trend because Time can over balance Price and when Time is up the Volume of sales will increase and force prices higher or lower.
Dates for Change in Trend — The stock market averages and individual stocks follow a seasonal change in trend which varies in different years, but by knowing the important dates and watching you will be able to determine a change in trend very quickly by applying all the other rules. When looking up dates for Change in Trend, consider whether the market has run from any high or low price 7 to 12 days, 18 to 21, 28 to 31, 42 to 49, 57 to 65, 85 to 92, 112 to 120, 150 to 157, or 175 to 185 days. The more important the top and bottom that these Time periods start from, the more important the change.
Market Over-Balanced — The Averages or individual stocks become over-balanced after they have advanced or declined a considerable period of Time, and the greater the Time period, the greater the correction or reaction. When a Time period on a decline exceeds Time period of a previous decline it indicates a change in trend. When price breaks a greater number of points than previous decline or reaction it indicates that the market is Over-Balanced and a change in trend is taking place.
Reverse this rule in a Bear Market. When stocks have been declining for a long period of Time, the first time that a rally exceeds Time period of a previous rally it is an indication that the trend is changing, at least temporarily. The first time that price rallies a greater number of points than a previous rally, it indicates that Space or Price movement is Over-Balanced and a change in trend has started. Time change is more important than reversal in price. Apply all of the rules to see if a change in trend is due at Time when these reversals take place.
When market is nearing the end of a long upswing or a long downswing and reaches the 3rd or 4th Section, swings upward will be smaller in price gains and Time period will be less than the previous section. This is an indication that a change in trend is due. In a Bear or declining market, when the loss in point becomes less than the previous section and Time period is less, it is an indication that Time cycle is running out.
RULE #8Periodi di tempo
Il fattore tempo e i periodi di tempo sono i più importanti per determinare un cambiamento di tendenza, perché il tempo può bilanciare il prezzo e quando il tempo è in aumento il volume delle vendite aumenterà e costringerà i prezzi a salire o scendere.
Date per il cambiamento di tendenza — Le medie del mercato azionario e i singoli titoli seguono un cambiamento di tendenza stagionale che varia nei diversi anni, ma conoscendo le date importanti e osservandole sarete in grado di determinare un cambiamento di tendenza molto rapidamente applicando tutte le altre regole. Quando si cercano le date per il cambiamento di tendenza, si consideri se il mercato è passato da un prezzo alto o basso da 7 a 12 giorni, da 18 a 21, da 28 a 31, da 42 a 49, da 57 a 65, da 85 a 92, da 112 a 120, da 150 a 157 o da 175 a 185 giorni. Quanto più importante è il punto di partenza di questi periodi, tanto più importante è la variazione.
Mercato sbilanciato — Le medie o i singoli titoli diventano sbilanciati dopo che sono avanzati o diminuiti per un periodo di tempo considerevole, e maggiore è il periodo di tempo, maggiore è la correzione o la reazione. Quando il periodo di tempo di un ribasso supera il periodo di tempo di un ribasso precedente, indica un cambiamento di tendenza. Quando il prezzo rompe un numero maggiore di punti rispetto al ribasso o alla reazione precedente, indica che il mercato è sovrastimato e che si sta verificando un cambiamento di tendenza.
Invertire questa regola in un mercato orso. Quando i titoli sono stati in calo per un lungo periodo di tempo, la prima volta che un rally supera il periodo di un rally precedente è un'indicazione che il trend sta cambiando, almeno temporaneamente. La prima volta che il prezzo fa un rally di un numero maggiore di punti rispetto a un rally precedente, indica che il movimento dello spazio o del prezzo è eccessivamente bilanciato e che è iniziato un cambiamento di tendenza. Il cambiamento di tempo è più importante dell'inversione del prezzo. Applicare tutte le regole per verificare se è in atto un cambiamento di tendenza nel momento in cui si verificano le inversioni.
Quando il mercato si avvicina alla fine di un lungo rialzo o di un lungo ribasso e raggiunge la terza o la quarta sezione, le oscillazioni al rialzo saranno più ridotte in termini di guadagni di prezzo e il periodo di tempo sarà inferiore rispetto alla sezione precedente. Ciò indica che è in atto un cambiamento di tendenza. In un mercato orso o in declino, quando la perdita di punti diventa inferiore alla sezione precedente e il periodo di tempo è minore, è un'indicazione che il ciclo di tempo si sta esaurendo.
Buy on Higher Tops and Bottoms
Buy when the market is making higher Tops and higher Bottoms which shows that the main trend is up. Sell when the market is making lower Tops and lower Bottoms which indicates the main trend is down. Time periods are always important. Check the Time period from previous Top to Top and from previous Bottom to Bottom. Also check the Time required for the market to move up from extreme low to extreme high and Time required for prices to move down from extreme high to extreme low.
Monthly High and Low Charts — When markets are slow and narrow, and especially for low priced stocks, all you need to do is keep up the monthly high and low chart; when activity starts you can start keeping a weekly high and low chart and for stock selling at very high levels, keep the daily high and low charts, but remember that 3-Day Swing Chart is much more important as a Trend Indicator than a daily high a low chart.
RULE #9Comprare sui massimi e sui minimi più alti
Comprate quando il mercato fa registrare massimi e minimi più alti, il che indica che la tendenza principale è al rialzo. Vendete quando il mercato fa registrare massimi e minimi più bassi, il che indica che la tendenza principale è al ribasso. I periodi di tempo sono sempre importanti. Controllate il periodo di tempo che intercorre tra il precedente massimo e quello attuale e tra il precedente minimo e quello attuale. Controllate anche il tempo necessario al mercato per salire da un minimo estremo a un massimo estremo e il tempo necessario ai prezzi per scendere da un massimo estremo a un minimo estremo.
Grafici mensili dei massimi e dei minimi — Quando i mercati sono lenti e stretti, soprattutto per i titoli con una bassa quotazione, è sufficiente tenere il grafico mensile dei massimi e dei minimi; quando inizia l'attività si può iniziare a tenere un grafico settimanale dei massimi e dei minimi e, per i titoli che vendono a livelli molto alti, tenere i grafici giornalieri dei massimi e dei minimi, ma ricordate che il grafico di oscillazione a 3 giorni è molto più importante come indicatore di tendenza di un grafico giornaliero dei massimi e dei minimi.
Change in Trend in Bull Market
A change in trend often occurs just before or just after holidays. The following dates are important. January 3, May 30, July 4, the early part of September, after Labor Day, October 10 to 14, November 3 to 8 in election years, and November 25 to 30, Thanksgiving, and December 24 to 28. This latter period may run into the early part of January, before a definite change in trend is indicated. When prices on the Industrial Averages or individual stocks break the last low on a 9-Point Swing Chart or break the last low on the swing on a 3-Day Chart it is an indication that trend is changing, at least temporarily.
Bear Market: in a declining market when prices cross the Top of the last upswing on a 9-Point Chart, or cross the top of the last upswing on a 3-Day Chart, it is the First Signal for a Change in Trend. When prices are at High Levels there are usually several swings up and down; then when market breaks the Low of the Last Swing it indicates a reversal and change in Trend. At low levels prices often narrow down and remain in a narrow trading range for some Time, then when they Cross the Top of the last upswing it is important for a Change in Trend. Always check to see if market is exactly 1, 2, 3, 4, or 5 years from any extreme High or Low price. Check back to see if the Time Period is 15, 22, 34, 42, 48 or 49 months from any extreme or low price, as these are important time periods to watch for Change in Trend.
RULE #10Cambio di tendenza nel mercato toro
Un cambiamento di tendenza si verifica spesso poco prima o poco dopo le festività. Le seguenti date sono importanti. 3 Gennaio, 30 Maggio, 4 Luglio, la prima parte di Settembre, dopo il Labor Day, dal 10 al 14 Ottobre, dal 3 all'8 Novembre negli anni delle elezioni, dal 25 al 30 Novembre, il Giorno del Ringraziamento e dal 24 al 28 Dicembre. Quest'ultimo periodo può protrarsi fino alla prima parte di Gennaio, prima che venga indicato un cambiamento di tendenza definitivo. Quando i prezzi delle medie industriali o dei singoli titoli rompono l'ultimo minimo su un grafico a 9 punti di oscillazione o rompono l'ultimo minimo dell'oscillazione su un grafico a 3 giorni, è un'indicazione che il trend sta cambiando, almeno temporaneamente.
Mercato orso: in un mercato in declino, quando i prezzi attraversano il massimo dell'ultimo rialzo su un grafico a 9 punti o il massimo dell'ultimo rialzo su un grafico a 3 giorni, è il primo segnale di un cambiamento di tendenza. Quando i prezzi si trovano a livelli elevati, di solito ci sono diverse oscillazioni verso l'alto e verso il basso; poi, quando il mercato rompe il minimo dell'ultima oscillazione, indica un'inversione e un cambiamento di tendenza. Ai livelli bassi i prezzi spesso si restringono e rimangono in uno stretto trading range per un certo periodo di tempo, poi quando attraversano il top dell'ultima oscillazione è importante per un cambiamento di tendenza. Verificate sempre se il mercato si trova esattamente a 1, 2, 3, 4 o 5 anni da un prezzo massimo o minimo estremo. Controllate anche se il periodo di tempo è di 15, 22, 34, 42, 48 o 49 mesi da qualsiasi prezzo estremo o basso, poiché questi sono periodi importanti da osservare per il cambiamento di tendenza.
Safest Buying and Selling Points
It is always safest to buy stocks after a definite Change in Trend has been established. After a stock makes bottom and has a rally, then follows the Secondary Reaction and it gets support at an higher bottom. When it starts to advance and crosses Top of the First Rally, it is the safest Place to Buy because market has already given an indication of uptrend. Stop Loss Orders can be placed under the Secondary Bottom.
Safest Selling Point — After a market has advanced for a long time and made Final High and has First Sharp quick Decline, then rallies and makes the Second Lower Top, and from this Top declines and Breaks the Low point of the First Decline, it is then Safer to Sell because it has given the Signal that the main Trend has changed to the Down side. 2-Day Reactions and Rallies: This is a most important time period in very fast active markets. Reactions will only run 2 days and not decline into the third day. This will happen many times before there is any indication of a Change in Trend. When a stock or Averages react only 2 days, it is in a very strong position. You will find some of these 2-day moves shown in the table for the 3-Day Chart.
In an active, Fast Declining Market, rallies will be sharp and fast, only lasting 2 days. Study the table for 3-Day Chart and you will find many rallies of this kind during the fall of 1929 and during 1930-31 when big Bear market was under way. Remember stocks are never too High to Buy as long as Trend is Up and they are never too Low to Sell as long as Trend is Down; but don’t overlook fact that you must always use a Stop Loss order for your protection. Always go with the trend and not against it. Buy stocks in Strong Position and Sell Stocks in Weak Positions.
RULE #11I punti di acquisto e vendita più sicuri
È sempre più sicuro acquistare titoli dopo che è stato stabilito un deciso cambiamento di tendenza. Dopo che un titolo ha toccato il fondo e ha fatto un rally, segue la reazione secondaria e ottiene un supporto a un fondo più alto. Quando inizia ad avanzare e supera il massimo del primo rally, è il posto più sicuro per acquistare perché il mercato ha già dato un'indicazione di tendenza al rialzo. Gli ordini di stop loss possono essere piazzati sotto il minimo secondario.
Punto di vendita più sicuro — Dopo che un mercato è avanzato per un lungo periodo, ha raggiunto il massimo finale e ha avuto il primo rapido declino, poi si è ripreso e ha fatto il secondo massimo inferiore, e da questo massimo è sceso e ha rotto il punto di minimo del primo declino, è più sicuro vendere perché ha dato il segnale che la tendenza principale è cambiata verso il basso. Reazioni e rally a 2 giorni: questo è un periodo di tempo molto importante nei mercati attivi molto veloci. Le reazioni dureranno solo 2 giorni e non scenderanno nel terzo giorno. Questo accadrà molte volte prima che ci sia un'indicazione di un cambiamento di tendenza. Quando un titolo o le medie reagiscono solo per 2 giorni, si trovano in una posizione molto forte. Alcuni di questi movimenti a 2 giorni sono riportati nella tabella del grafico a 3 giorni.
In un mercato attivo e in rapida discesa, i rally saranno bruschi e veloci e dureranno solo 2 giorni. Studiate la tabella del Grafico a 3 giorni e troverete molti rally di questo tipo durante l'autunno del 1929 e durante il 1930-31, quando era in corso il grande mercato dell'Orso. Ricordate che i titoli non sono mai troppo alti per essere acquistati finché la tendenza è al rialzo e non sono mai troppo bassi per essere venduti finché la tendenza è al ribasso; ma non trascurate il fatto che dovete sempre utilizzare un ordine di stop loss per proteggervi. Seguite sempre la tendenza e non andate contro di essa. Acquistate titoli in posizione forte e vendete titoli in posizione debole.
Price Gains in Fast Moves
When markets are very active and advancing or declining very fast they average about 1 point per calendar day. When the Movement on Averages or individual stocks is 2 points or more per day, it is far above normal and doesn’t last very long. Movements of this kind occur when there are Short Time Periods and a quick corrective reaction or decline in a Bull Market. When the Trend is down in a Bear Market these quick fast rallies correct the position in a short period of time.
I want to impress upon you strongly that if you expect to make a success in the stock market you must put in plenty of time studying, because the more time you put in, the more knowledge you gain, the more profits you will take out later. Over 45 years of practical experience in trying and testing rules have proven to me what is required for your success. I have given you the rules that will work; you must do your part; you must learn the rules, act on them at the right time and put them into execution.
RULE #12Guadagni di prezzo in movimenti rapidi
Quando i mercati sono molto attivi e avanzano o scendono molto velocemente, la media è di circa 1 punto per giorno di calendario. Quando il movimento delle medie o dei singoli titoli è di 2 punti o più al giorno, è di gran lunga superiore alla norma e non dura a lungo. Movimenti di questo tipo si verificano quando ci sono periodi di tempo brevi e una rapida reazione correttiva o un calo in un mercato rialzista. Quando la tendenza è al ribasso in un mercato orso, questi rapidi rally correggono la posizione in un breve periodo di tempo.
Voglio sottolineare con forza che se volete avere successo nel mercato azionario dovete dedicare molto tempo allo studio, perché più tempo dedicate, più conoscenze acquisite, più profitti otterrete in seguito. Oltre 45 anni di esperienza pratica nel provare e testare le regole mi hanno dimostrato cosa è necessario per il vostro successo. Io vi ho dato le regole che funzioneranno; voi dovete fare la vostra parte: imparare le regole, agire al momento giusto e metterle in pratica.
In case you missed the first part of the rules, here is the link, enjoy your reading: https://www.daxtradingideas.com/p/24-never-failing-rules
I find these articles very interesting. Resurrect books from almost 100 years ago and see that are still tremendously relevant is amazing.