
Why Investment is a Solved Problem
Index investing and the psychological traps that mess up our portfolios

«The only function of economic forecasting is to make astrology look respectable» — John Kenneth Galbraith
Market timing, stock picking, optimization, lightening, portfolio rotations. All correct or rather, all «theoretically» correct. It is the alphabet of modern investing, the language we use every day to tell ourselves that by studying a little more, looking at one more chart, or identifying the «right theme» before others do, we will be able to beat the market. The reality, however, is much less romantic. And above all, it is merciless.
Those who love slogans more than numbers live in a perpetual hunt for the winning product, sector of the year, dominant narrative of the moment: metals, energy, AI, biotech, emerging markets, small caps, value, growth. Every cycle has its fad, every fad has its army of new followers. All this is deeply human, almost heroic in its naivety; a quixotic view of investing: fighting windmills in the hope that, sooner or later, you will knock one down. But data tells a different story, a much less fascinating story, but one that is tremendously more useful. All daily effort that average investor makes to understand where financial markets are going is, in the long run, inefficient, sub-optimal, in a word, useless.
This should not be confused with the work of the so-called «primary hand» of the market: hedge funds, asset management companies, large brokers. These entities have to engage in market making, arbitrage, algorithmic trading and short-term risk management. It is their job. They serve to ensure liquidity, continuity of trading and stability of the underlying assets, but they are not a replicable model for the investor, and above all, they are not a necessary model for achieving long-term returns. And this brings us to the central point that I will explore in this article.
«L’unica funzione delle previsioni economiche è quella di rendere rispettabile l’astrologia» — John Kenneth Galbraith
Market timing, stock picking, ottimizzazione, alleggerimento, rotazioni di portafoglio. Tutto giusto o meglio, tutto «teoricamente» giusto. È l’alfabeto dell’investimento moderno, il linguaggio con cui ogni giorno ci raccontiamo che, studiando un po’ di più, osservando un grafico in più o intercettando prima degli altri il «tema giusto», riusciremo a battere il mercato. La realtà, però, è molto meno romantica. E soprattutto è impietosa.
Chi ama gli slogan più dei numeri vive in una perenne caccia al prodotto vincente, al settore dell’anno, alla narrativa dominante del momento: metalli, energia, IA, biotech, emergenti, small cap, value, growth. Ogni ciclo ha la sua moda, ogni moda ha il suo esercito di nuovi adepti. Tutto questo è profondamente umano, quasi eroico nella sua ingenuità; una visione donchisciottesca dell’investimento: combattere i mulini a vento sperando, prima o poi, di abbatterne uno. Ma i dati raccontano un’altra storia, una storia molto meno affascinante, ma tremendamente più utile. Tutto lo sforzo quotidiano che l’investitore medio compie per capire dove andranno i mercati finanziari è, nel lungo periodo inefficiente, non sub-ottimale, in una parole inutile.
Questo non va confuso con il lavoro della cosiddetta «mano primaria» del mercato: hedge fund, case di gestione, grandi broker. Questi soggetti devono fare market making, arbitraggio, trading algoritmico, gestione del rischio di brevissimo termine. È il loro mestiere. Servono a garantire liquidità, continuità degli scambi e stabilità dei sottostanti, ma non sono un modello replicabile per l’investitore finale, e soprattutto non sono un modello necessario per ottenere rendimento nel lungo periodo. Ed è qui che arriviamo al punto centrale che approfondirò in questo articolo.
Numbers don’t lie
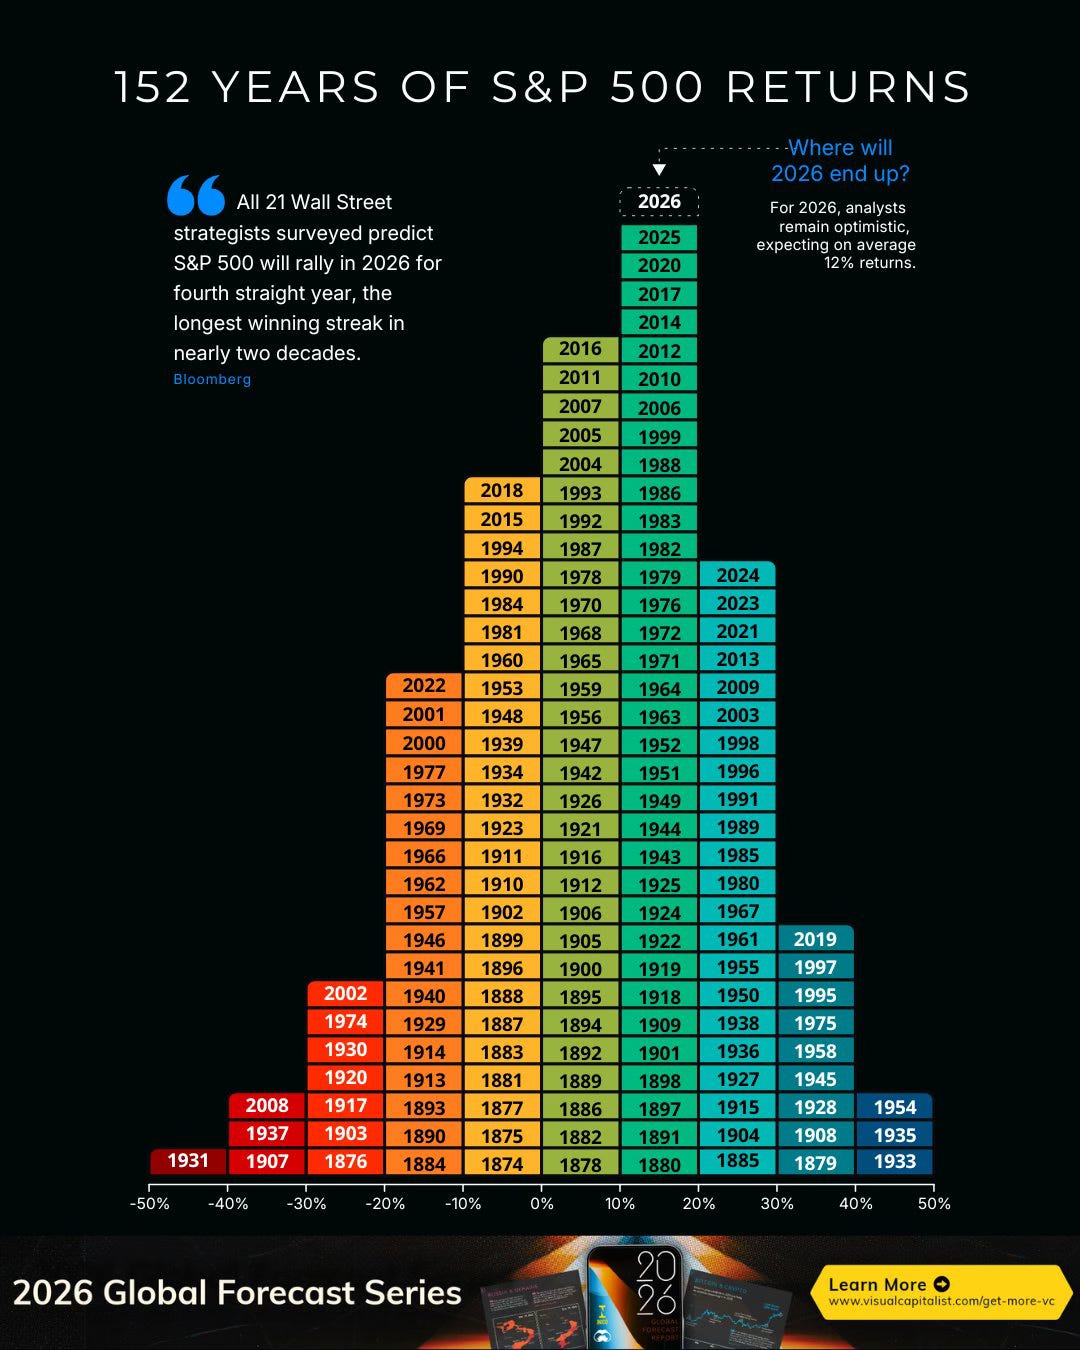
When we look at the numbers honestly, some fundamental truths emerge that are worth exploring. One of these is the average annual growth of indices over the long term. S&P500, the most widely used US stock benchmark in the world, has historically shown very solid average annual performance. In terms of total return from the 1950s to the present day, annualized return has been around 10% per year over ultra-decadal and multi-decadal horizons. This means that $10,000 invested in 1957 would have grown to over $1 million in subsequent years if dividends had been reinvested, a huge increase reflects the effect of compound interest over time.
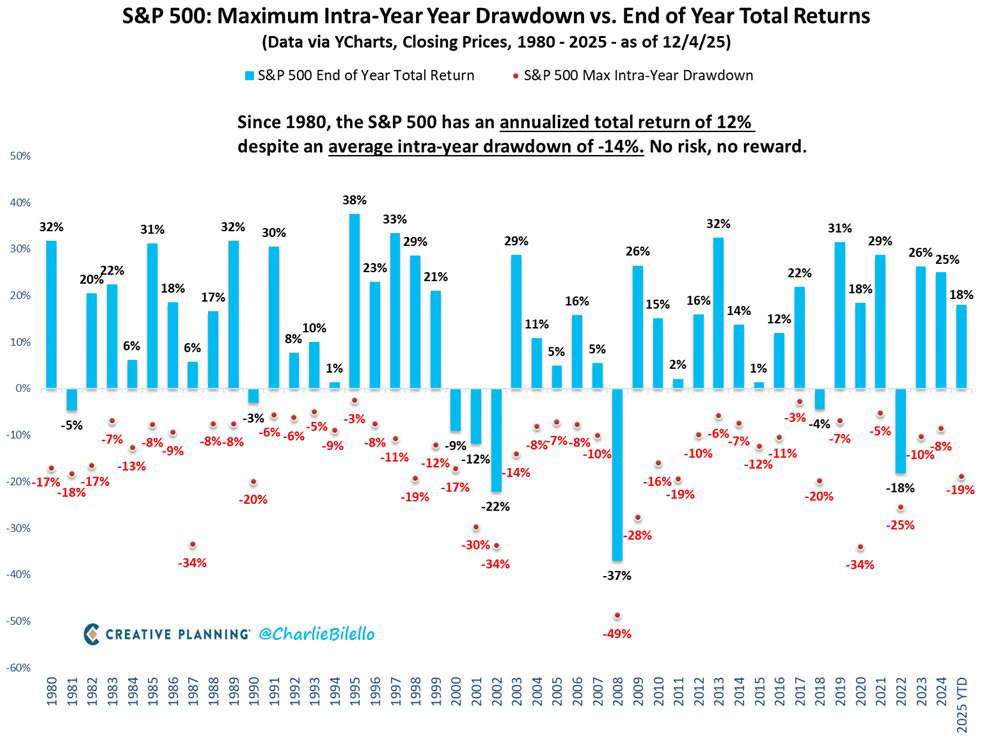
Volatility is enormous in the short term, but it dampens over the long term. If we look at periods from 1950 to 2025, the average annual drawdowns of the S&P500 were around -13.7%, while the average annual return was +11.3% over the same period. There have been disastrous years, such as 2008, when the drawdown exceeded -48% and the year closed with a total of -37%, or 1974, with a drawdown of almost -38% and a sharp decline over the period. Yet these declines are systematically offset in the medium to long term: after crashes of 2008 or the pandemic, the recovery led to tens of percent cumulative gains in the following decades. This means that volatility is a stable feature of the markets, but it doesn’t affect the underlying trend: financial markets grow over time.
Even in «lost decades», context changes with the investment horizon. It is true there are periods when the S&P500 has yielded very little over many years. A historical example is the period from 1966 to 1981, when the overall index yielded a total return of approximately +32.95% over 16 years (equivalent to a CAGR of around 1.8% per year) due to inflation and economic stagnation. The same was true between 2000 and 2010, when the dot-com bubble caused considerable panic and frustration among investors, who were fascinated by the glitz of the new economy. However, these difficult decades don’t erase the long-term potential: the subsequent recovery more than compensated for these slowdowns, thanks to the effect of compound interest and growth of corporate earnings over entire decades. And this is where the fundamental concept comes into play: time in the market almost always beats timing the market.
I numeri non mentono
Quando guardiamo i numeri con onestà, emergono alcune verità fondamentali da approfondire. Una di queste è la crescita media annua degli indici nel lungo periodo. L’S&P500, il benchmark azionario statunitense più utilizzato al mondo, ha mostrato storicamente una performance media annua molto solida. In termini di rendimento totale dagli anni ’50 fino ai giorni nostri, il rendimento annualizzato si è attestato intorno al 10% all’anno su orizzonti ultra-decennali e pluri-decennali. Questo significa che $10.000 investiti nel 1957 sarebbero diventati oltre 1 milione di dollari negli anni successivi se i dividendi fossero stati reinvestiti, una crescita enorme che riflette l’effetto dell’interesse composto nel tempo.
La volatilità è enorme nel breve, ma si smorza sul lungo termine. Se guardiamo dal 1950 al 2025 scopriamo che i drawdown annuali medi dell’S&P500 sono stati di circa -13,7%, mentre il rendimento medio annuale è stato di +11,3% nello stesso arco di tempo. Ci sono stati anni disastrosi come il 2008 dove il drawdown ha superato il -48% e l’anno ha chiuso con un -37% sul totale, oppure nel 1974 con drawdown di quasi -38% e un forte ribasso di periodo. Eppure questi ribassi vengono sistematicamente compensati nel medio-lungo periodo: dopo i crolli del 2008 o della pandemia, la ripresa ha portato a decine di percentuali di guadagno cumulato nei decenni successivi. Questo significa che la volatilità è una caratteristica stabile dei mercati, ma non inficia la tendenza di fondo: i mercati finanziari crescono nel tempo.
Anche nei «decenni perduti» il contesto cambia con l’orizzonte di investimento. È vero: esistono periodi in cui l’S&P500 ha reso pochissimo nell’arco di molti anni. Un esempio storico è l’era 1966-1981, in cui l’indice complessivo portò un rendimento totale di circa +32,95% in 16 anni (pari a un CAGR intorno all’1,8% annuo) a causa di inflazione e stagnazione economica. Stesso dicasi tra il 2000 e il 2010, dove la bolla dot com causò non poco panico e frustrazione tra gli investitori, affascinati dai bagliori della new economy. Tuttavia, questi decenni difficili non cancellano il potenziale del lungo periodo: la ripresa successiva ha compensato ampiamente questi rallentamenti, proprio grazie all’effetto dell’interesse composto e alla crescita di utili societari su decenni interi. Ed è qui che entra in gioco il concetto fondamentale: il tempo nel mercato batte quasi sempre il timing del mercato.
Investment today is a solved problem
With the available data, we can say without hesitation that investment, understood as the generation of real returns over the long term, is a problem has already been solved. It doesn’t mean markets will rise forever. This is a way of not understanding, a silly argument used to discredit a thesis that doesn’t want to understand. Markets fall, move sideways, go through crises, recessions, geopolitical shocks and periods of panic. It has always been this way and always will be. But the point is not the short- or mid-term trajectory; the point is mathematical structure of equity investment through market indices.
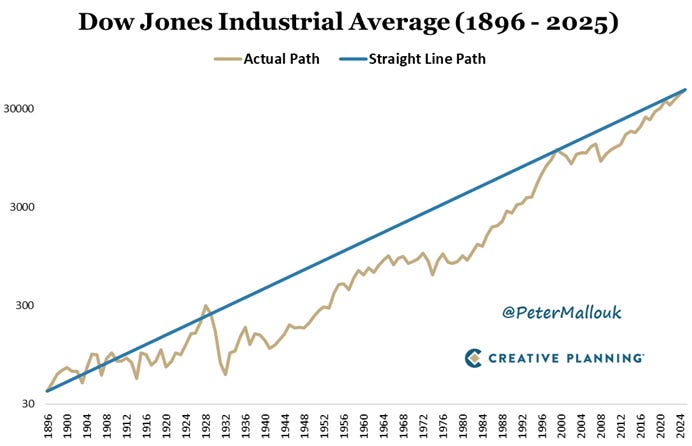
Passive benchmark investing is not a philosophy or a religion. It is a logical consequence of the construction of the indices themselves. The first historical example is the Dow Jones Industrial Average. An index that is often criticized, considered «old», unrepresentative, even obsolete. Yet it is precisely the Dow Jones shows us the key mechanism. In fact, it is not a static container, it doesn’t buy and hold forever, but continuously replaces companies no longer represent the real economy with those best embody it. The giants of the past have been gradually pushed out, replaced by companies capable of capturing growth, profits and capitalization.
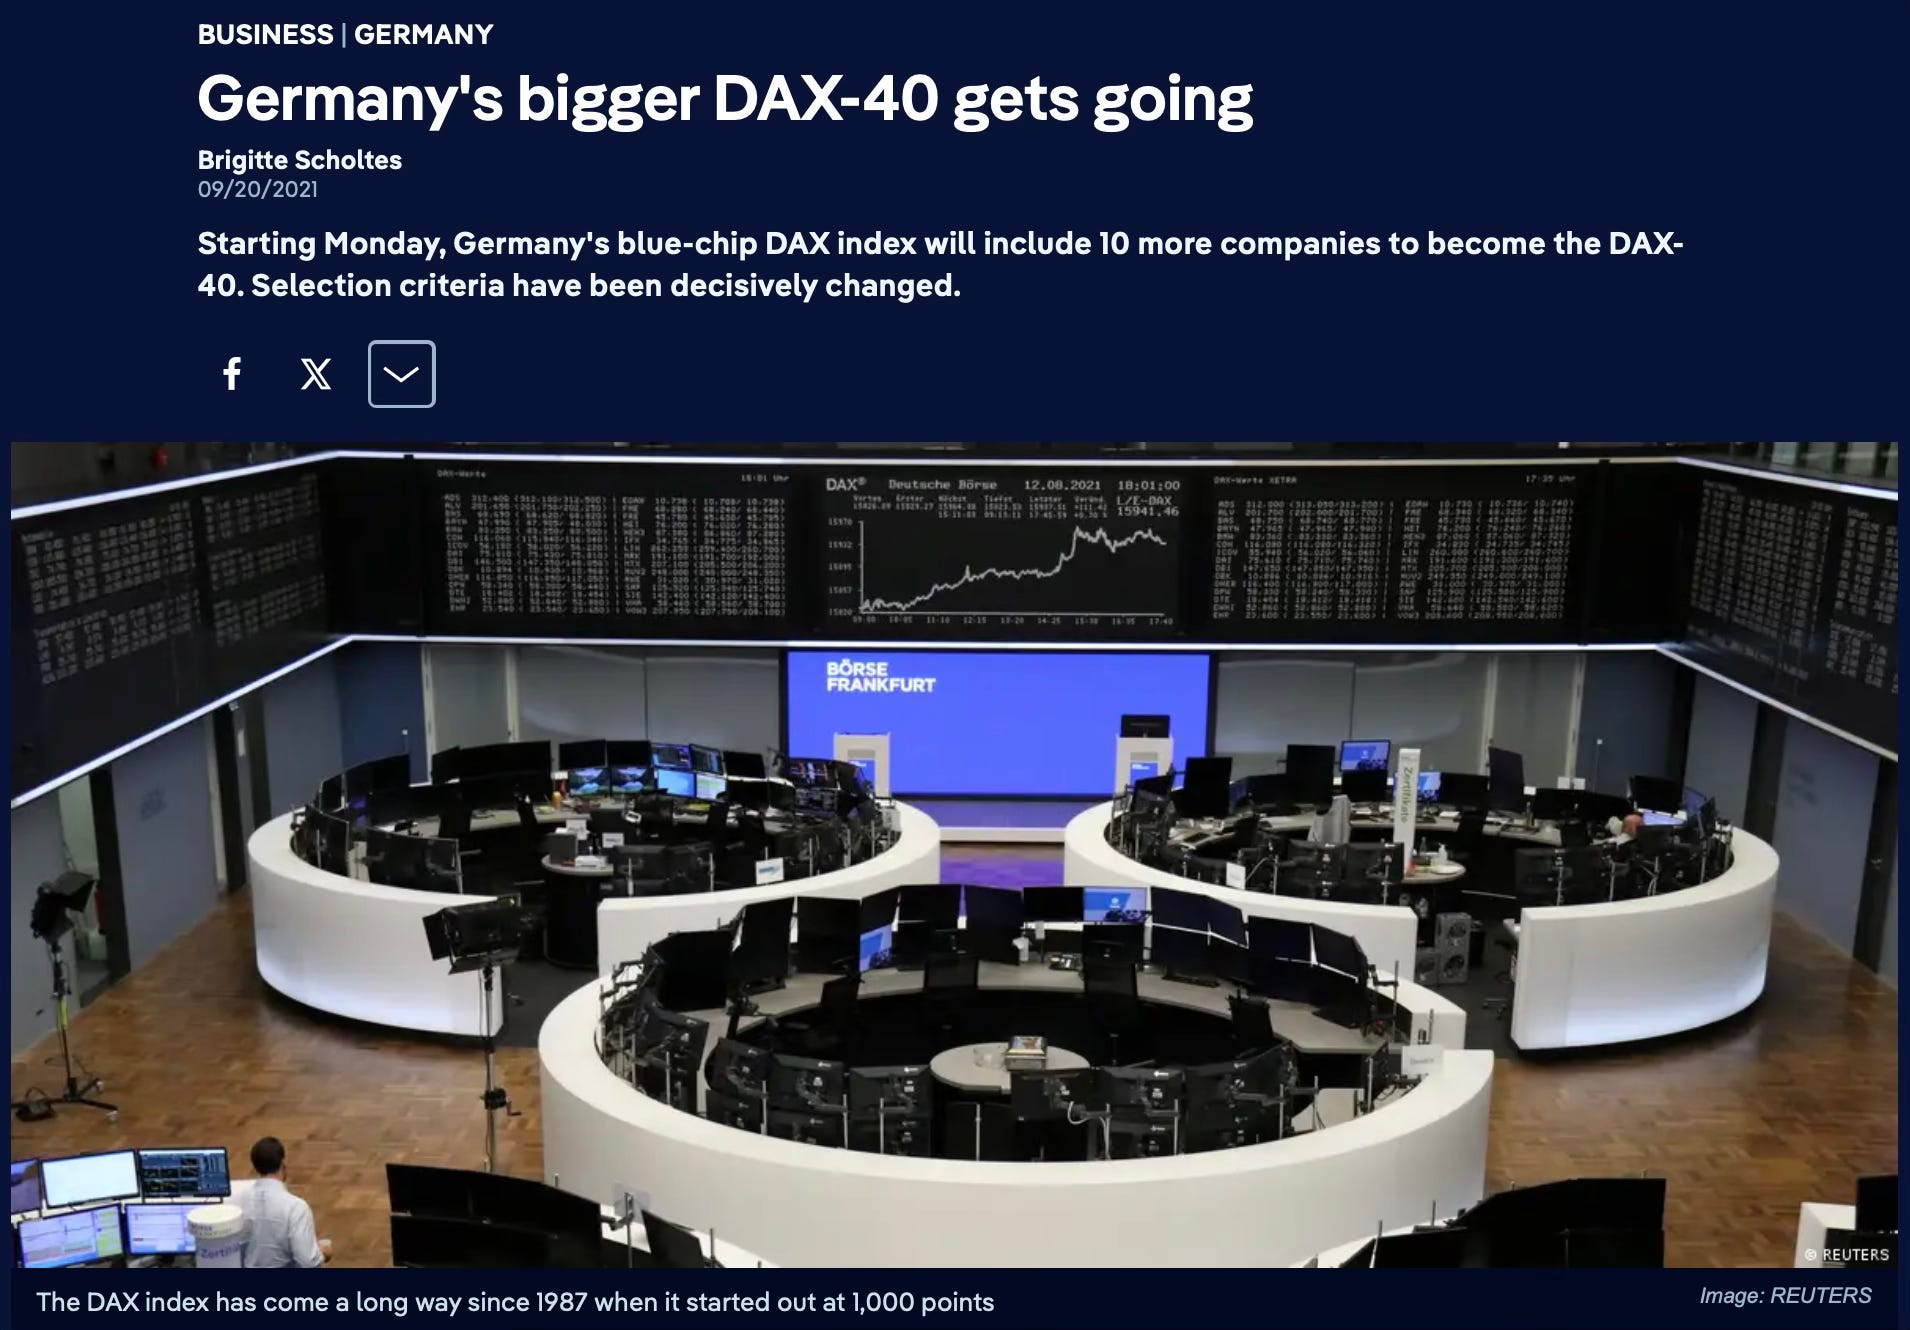
The same principle applies, even more efficiently, to the S&P500. Here, selection is based on stringent criteria: capitalization, liquidity, profitability and sector representativeness. A company that stops growing, loses relevance, or no longer meets the requirements is removed, without sentimentality. Nasdaq 100 further amplifies this logic: it is a machine designed to concentrate innovation, growth, and technology, even at the expense of more extreme volatility. And then in Europe, there is the DAX Index. For years a symbol of rigidity, it has finally been converted into the DAX 40, with more modern criteria, greater sector diversification and a stronger focus on the quality of the companies included. Here too, the direction is clear: index adapts to the economy, not the other way around. This means one very simple thing: investing in indices means investing in a system that automatically eliminates the worst inefficiencies.
L’investimento oggi è un problema risolto
Con i dati che abbiamo a disposizione possiamo affermarlo senza esitazioni: l’investimento, inteso come generazione di rendimento reale nel lungo periodo, è un problema già risolto. Questo non significa che i mercati saliranno per sempre. Questa è una caricatura, un argomento stupido usato per screditare una tesi che non si vuole comprendere. I mercati scendono, lateralizzano, attraversano crisi, recessioni, shock geopolitici e fasi di panico. È sempre stato così e sempre sarà così. Ma il punto non è la traiettoria di breve o medio periodo, il punto è la struttura matematica dell’investimento azionario tramite indici di mercato.
L’investimento passivo a benchmark non è una filosofia, né una religione. È una conseguenza logica della costruzione degli indici stessi. Il primo esempio storico è il Dow Jones Industrial Average. Un indice spesso criticato, ritenuto «vecchio», poco rappresentativo, addirittura obsoleto. Eppure è proprio il Dow Jones a mostrarci il meccanismo chiave. Esso infatti, non è un contenitore statico, non compra e mantiene per l’eternità, bensì sostituisce continuamente le aziende che non rappresentano più l’economia reale con quelle che meglio la incarnano. I giganti del passato sono stati progressivamente espulsi e al loro posto sono entrate aziende in grado di intercettare crescita, profitti e capitalizzazione.
Lo stesso principio vale, in forma ancora più efficiente, per l’S&P500. Qui la selezione è basata su criteri stringenti: capitalizzazione, liquidità, redditività, rappresentatività settoriale. Un’azienda che smette di crescere, che perde rilevanza o che non soddisfa più i requisiti, viene rimossa, senza sentimentalismi. Il Nasdaq 100 amplifica ulteriormente questa logica: è una macchina progettata per concentrare innovazione, crescita e tecnologia, anche a discapito di una volatilità più estrema. E poi c’è il DAX in Europa. Per anni simbolo di rigidità, finalmente trasformato in DAX 40, con criteri più moderni, maggiore diversificazione settoriale e un’attenzione più forte alla qualità delle aziende incluse. Anche qui, la direzione è chiara: l’indice si adatta all’economia, non il contrario. Questo significa una cosa molto semplice: investire negli indici significa investire in un sistema che elimina automaticamente le inefficienze peggiori.
The myth of the «lost decade»
The classic objection is always the same: what if there is a lost decade? It is a legitimate question and has already been answered by history.
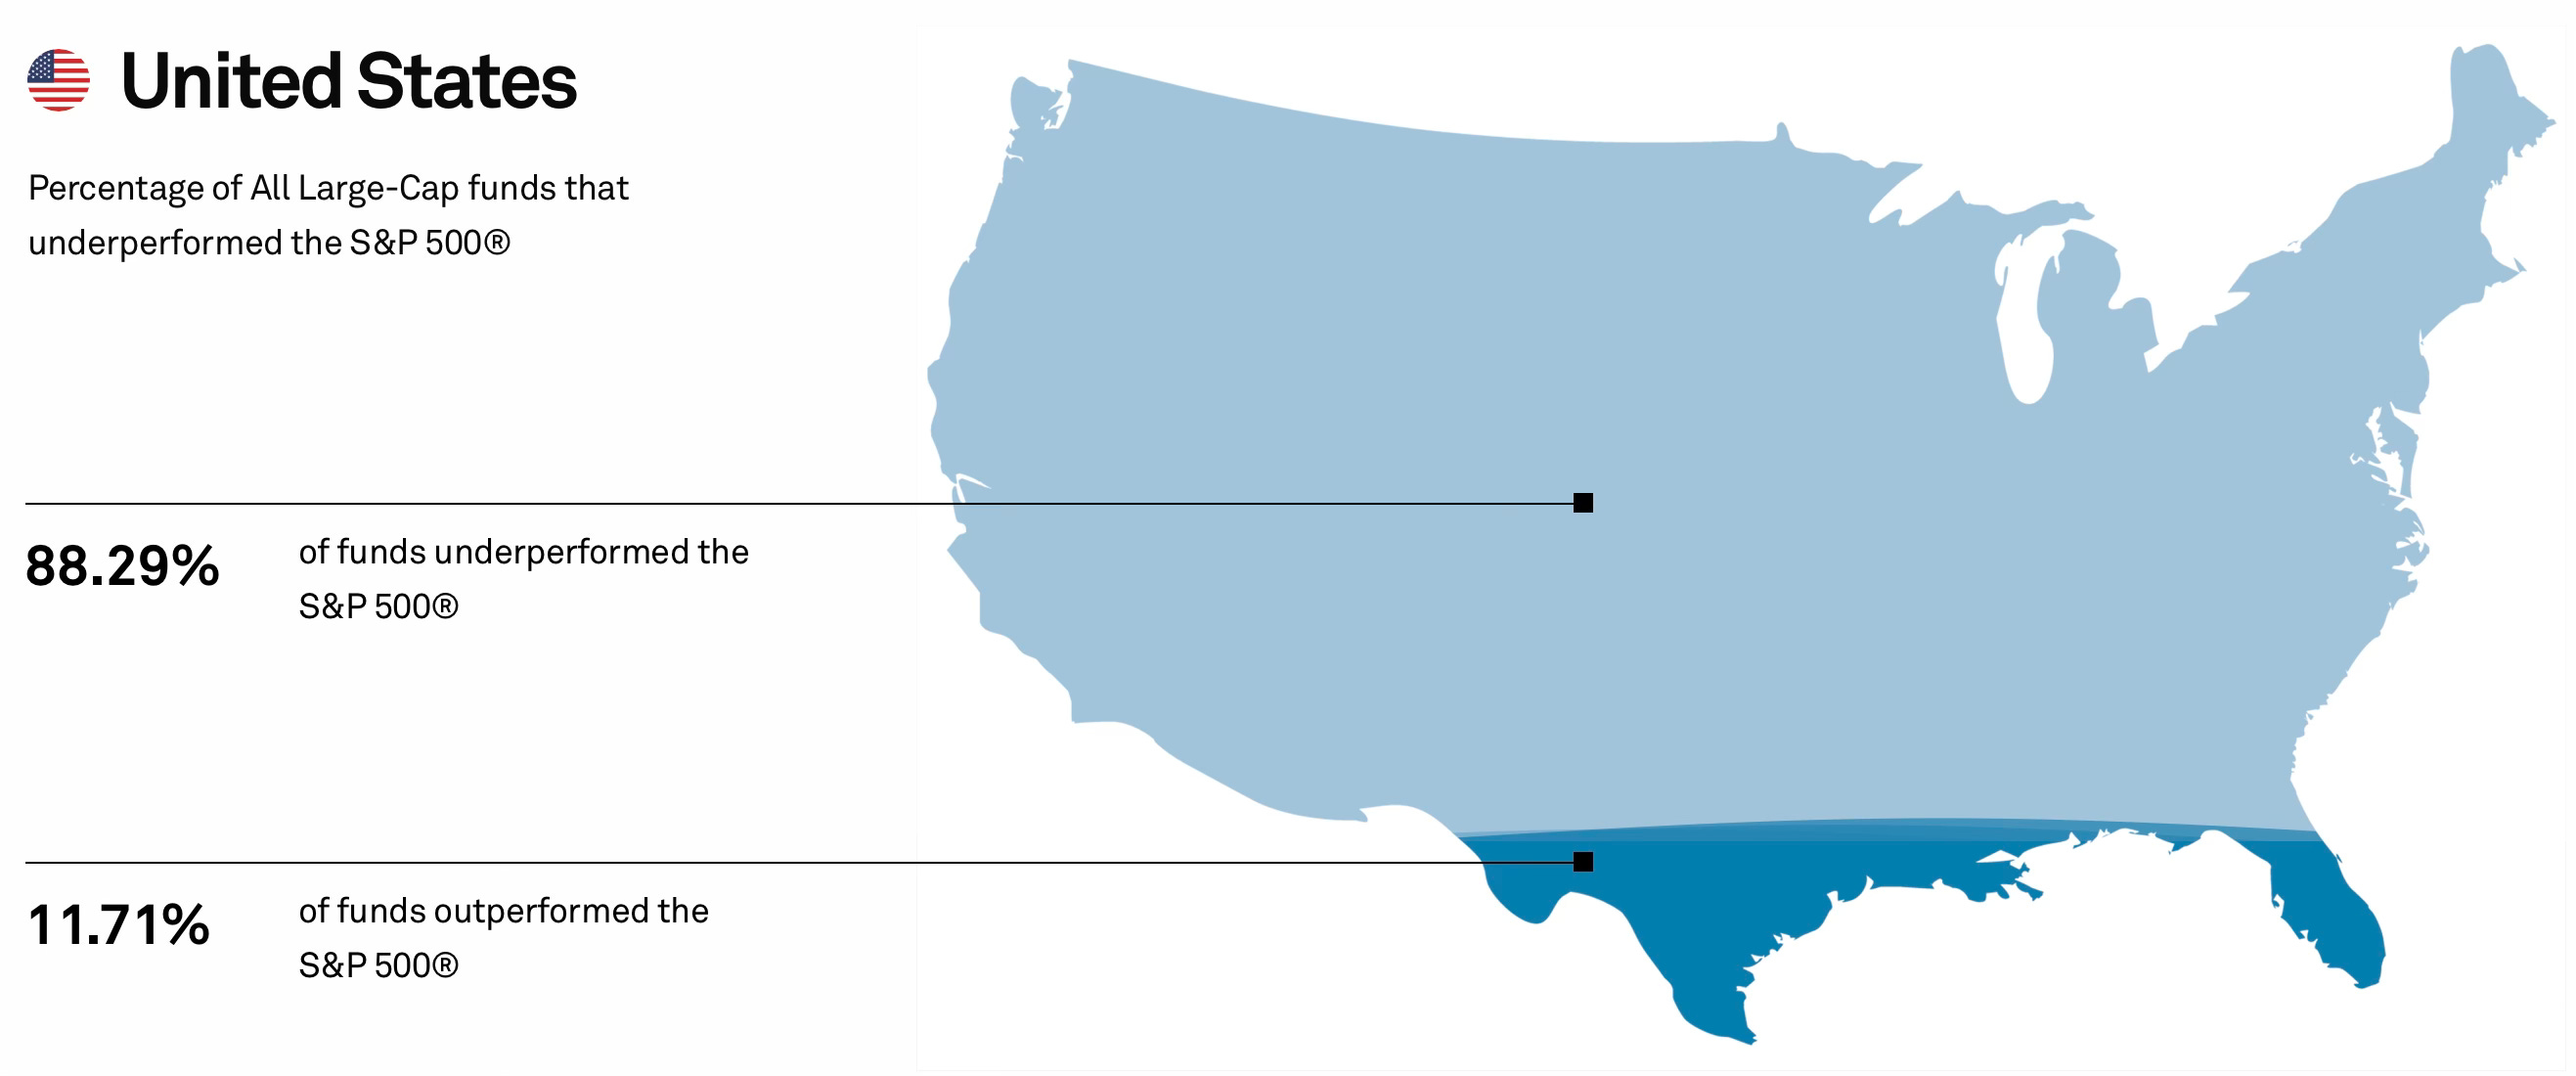
As we have seen, there are periods of 10 years, sometimes even longer, in which an index may offer zero or disappointing returns. This happens when high valuations, macroeconomic shocks and slow policymaking collide. But the point is another: what is the investor’s real time horizon? On average, we are talking about 30 or 40 years. Over this time frame, even a mediocre decade becomes a statistical fluctuation; compound interest doesn’t work in a straight line, but it works nonetheless. And this is where the numbers come into play, the real ones. SPIVA reports demonstrate this every year: the majority of funds underperform their benchmark in the mid to long term. Not because of incompetence, but because of their structure. Of course, there are forward-thinking and highly reliable management companies, enlightened minds that have been guaranteeing respectable performance for years, but we are talking about a small circle in a world of underperformance. Costs, turnover, behavioral biases, commercial pressure. All elements erode returns. So why is performance lacking?
Because everyone claims to be a passive investor, but few really are. In times of volatility, volumes explode, portfolios are turned upside down and investors switch from one product to another in pursuit of the illusion of control. Markets don’t move primarily because of geopolitics or technical analysis: they move because of fear and greed and you only need to look at a volume chart to realize this. Peaks almost always coincide with market highs and lows: people buy when greed is at its peak and sell when fear is unbearable. In calm phases, on the other hand, arrogance kicks in. Investors feel smarter than average, faster, more clear, and that’s precisely when they set themselves up for their next mistake.
Il mito del «decennio perduto»
L’obiezione classica è sempre la stessa: e se capitasse un decennio perduto? È una domanda legittima, e anche già risposta dalla storia.
Come abbiamo osservato, esistono periodi di 10 anni, talvolta anche qualcosa in più, in cui un indice può offrire rendimenti nulli o deludenti. Questo accade quando valutazioni elevate, shock macroeconomici e lentezza dei policymaker si scontrano. Ma il punto è un altro: qual è l’orizzonte temporale reale dell’investitore? Mediamente, parliamo di 30 o 40 anni. In questo arco temporale, anche un decennio mediocre diventa un’oscillazione statistica, l’interesse composto non lavora in linea retta, ma lavora comunque. Ed è qui che entrano in gioco i numeri, quelli veri. I report SPIVA lo dimostrano ogni anno: la stragrande maggioranza dei fondi sotto-performa il benchmark di riferimento nel medio-lungo periodo. Non per incompetenza, ma per struttura. Per carità, esistono delle lungimiranti e affidabilissime case di gestione, menti illuminate che garantiscono da anni performance di tutto rispetto, ma parliamo di una cerchia ristretta in un mondo di sotto-performance. Costi, turnover, bias comportamentali, pressione commerciale. Tutti elementi che erodono rendimento. Allora perché le performance non arrivano?
Perché tutti si dichiarano investitori passivi, ma pochi lo sono davvero. Nei momenti di volatilità i volumi esplodono, i portafogli vengono stravolti, si passa da un prodotto all’altro inseguendo l’illusione del controllo. I mercati non si muovono principalmente per geopolitica o analisi tecnica: si muovono per paura e avidità e basta osservare un grafico dei volumi per rendersene conto. I picchi coincidono quasi sempre con massimi e minimi di mercato: si compra quando l’avidità è al massimo, si vende quando la paura è insopportabile. Nelle fasi di calma, invece, scatta l’arroganza. L’investitore si sente più intelligente della media, più veloce, più lucido, ed è proprio lì che prepara il prossimo errore.
Core, satellite, and reality portfolios
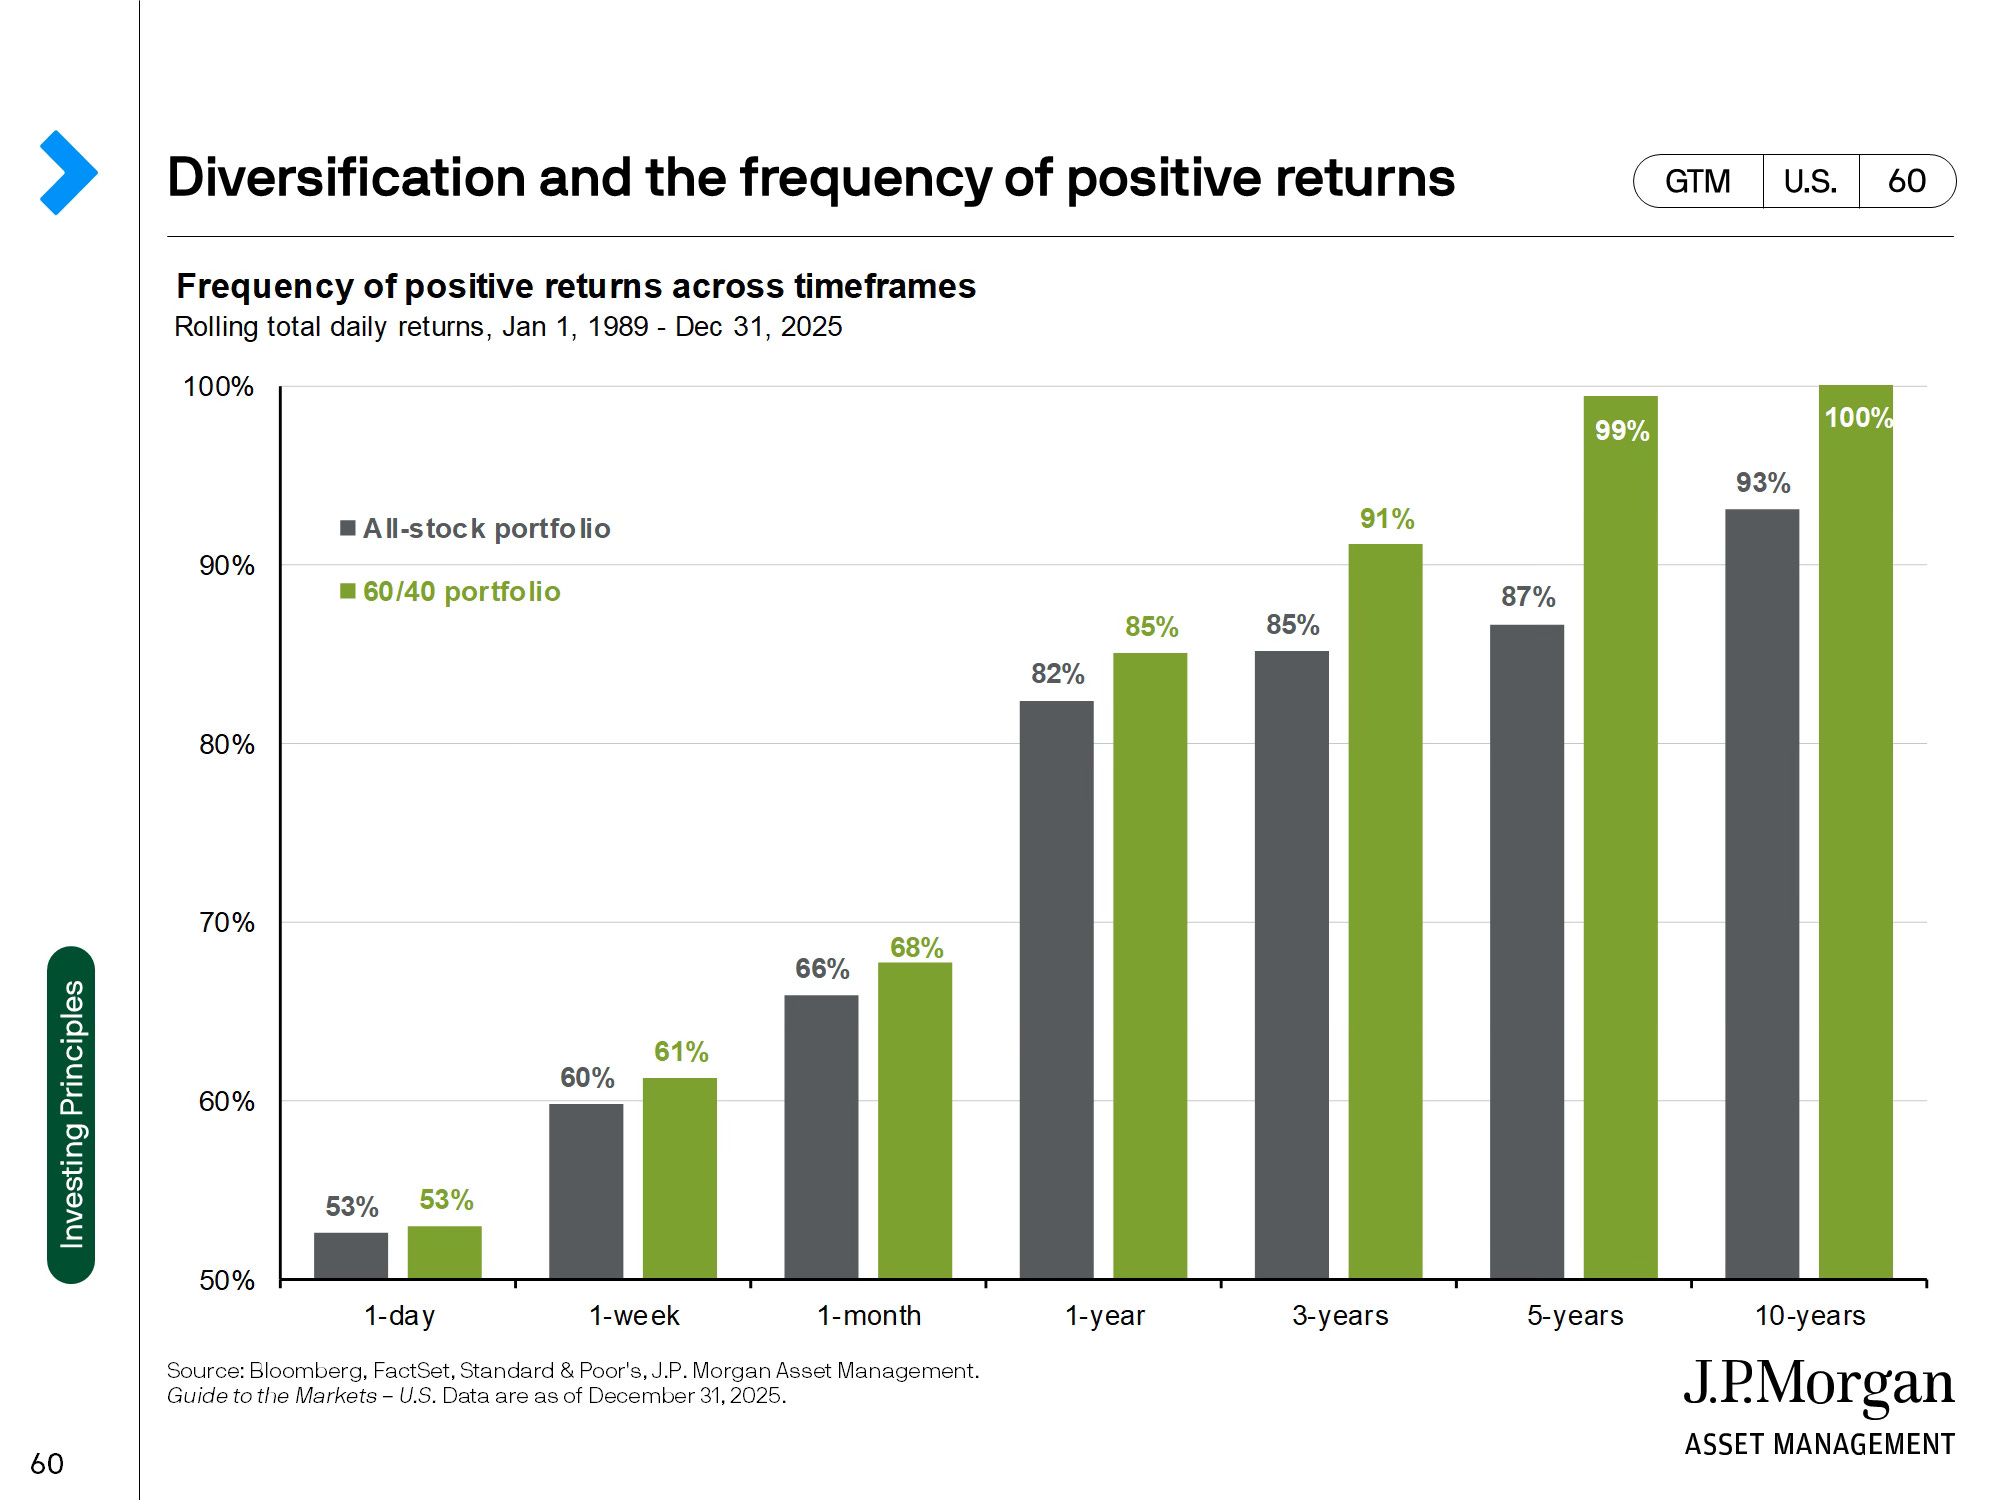
When we talk about indices, we’re talking about the stock market. This approach cannot be automatically extended to all asset classes, but precisely for this reason, the solution is simpler than we would like to admit. A core-satellite structure is more than sufficient: a solid, diversified core built on stocks and bonds. A classic 60/40, adaptable, integrable with gold, cash, or other defensive instruments. Around it, a small satellite part, for those who feel the need to express visions, experiment, speculate.
Another sensible objection is that «today, markets often fall together», and this is absolutely true. Financial globalization has made correlations higher and crises more synchronized, but it has also made recovery faster, because the system is designed to absorb shocks, not to collapse. Indices exist to finance companies, to represent real economies, to channel capital, not to destroy it.
There will always be periods of panic: we cannot avoid them, but we can learn to live with them. Concentrated markets will always generate short squeezes, panic selling and extreme narratives. As long as a few stocks move huge masses, this will be the case. Our job is not to look for conspiracies or predict the great reset. Our job is to optimize the time we have available. It has worked for 150 years and there is no concrete sign that it will stop working in the next 10, 20, or 30 years. And if one day everything really does go to zero, we will have much bigger problems than a portfolio to rebalance. Until then, the solution is surprisingly simple: buy, hold, forget, and above all, don’t regret.
Portafoglio core, satellite e realtà
Quando parliamo di indici, parliamo di mercato azionario. Questo approccio non è estendibile in modo automatico a tutte le asset class, ma proprio per questo la soluzione è più semplice di quanto si voglia ammettere. Una struttura core-satellite è più che sufficiente: una parte centrale solida, diversificata, costruita su azioni e obbligazioni. Un classico 60/40, adattabile, integrabile con oro, liquidità o altri strumenti difensivi. Intorno, una parte satellite ridotta, per chi sente il bisogno di esprimere visioni, sperimentare, speculare.
Un’altra obiezione sensata è che «oggi i mercati scendono spesso tutti insieme», ed è assolutamente vero. La globalizzazione finanziaria ha reso le correlazioni più alte e le crisi più sincronizzate, ma ha anche reso la ripresa più rapida, perché il sistema è progettato per assorbire shock, non per collassare. Gli indici esistono per finanziare le aziende, per rappresentare economie reali, per canalizzare capitale, non per distruggerlo.
Le fasi di panico ci saranno sempre: non possiamo evitarle, ma possiamo imparare a conviverci. Mercati concentrati genereranno sempre short squeeze, panic selling e narrazioni estreme. Finché pochi titoli muoveranno masse enormi, sarà così. Il nostro compito non è cercare complotti o prevedere il grande reset. Il nostro compito è ottimizzare il tempo che abbiamo a disposizione. Ha funzionato per 150 anni e non c’è alcun segnale concreto che smetterà di funzionare nei prossimi 10, 20 o 30. E se un giorno tutto dovesse davvero azzerarsi, avremo problemi ben più grandi di un portafoglio da ribilanciare. Fino ad allora, la soluzione è sorprendentemente semplice: compra, mantieni, dimentica, e soprattutto, non pentirti.