The Fear & Greed Index
A quick guide to the workings of FGI designed by CNN, which helps us with objective data, to analyze real-time sentiment of major financial markets
«Most of these Harvard graduates aren't worth shit. You need poor, smart, hungry people with no feelings. Sometimes you win, sometimes you lose but you keep fighting, and if you want a friend get a dog» — Gordon Gekko
Any sensible person who has had anything to do with financial markets or who loves movies cannot have missed «Wall Street — Money Never Sleeps», a masterpiece and representation of the follies of human beings. Finance back in the day was a representation of the mood of investors. At that time it was much clearer and more visible, there was no internet yet and exchanges were at the cries. Insiders meandered the streets, brokers and salesmen spent 15 hours on the phone trying to sell any shred of stock. The cross-section of finance at the time is perfectly successful and highlights all psychological implications of investor fear and greed. So much so that CNN built an indicator on it. Let’s dig in.

Qualunque persona di buon senso che abbia avuto a che fare con i mercati finanziari o che ami il cinema, non può non aver visto «Wall Street — Il denaro non dorme mai», capolavoro e rappresentazione delle follie dell’essere umano. La finanza di un tempo era la rappresentazione dell’umore degli investitori. A quel tempo era molto più chiara e visibile, ancora non c’era internet e i scambi erano alle grida. Gli insider serpeggiavano per le strade, broker e venditori passavano 15 ore al telefono cercando di vendere qualsiasi straccio di azione. Lo spaccato della finanza dell’epoca è perfettamente riuscito e mette in risalto tutti i risvolti psicologici dell’investitore, la paura e l’avidità. Tanto che la CNN ci ha costruito un indicatore. Approfondiamo.
How it works
The F&G Index is a tool used by smart-investors to evaluate the market. It is based on the premise that excessive fear can cause securities to trade well below their intrinsic value (buy, extreme fear) while, at the same time, unbridled greed can cause securities to be offered far above what they should be worth (sell, extreme greed). Some skeptics believe that the index is not a good investment tool because it encourages a market timing strategy rather than a buy-and-hold strategy. The CNN Fear and Greed Index looks at seven different factors to determine the amount of fear and greed in the market. They are:
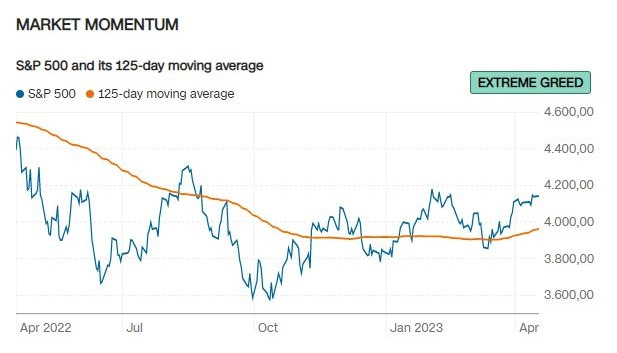
1. Momentum of stock price — It is useful to look at stock market levels compared to those of the past few months. When S&P500 is above its moving average or the previous 125 trading days, it is a sign of positive momentum. If, on the other hand, the index is below this average, it means investors are becoming nervous. The F&G Index uses slowing momentum as a sign of fear and rising momentum of greed.
Come funziona
L'indice della paura e dell'avidità è uno strumento utilizzato dagli smart-investors per valutare il mercato. Si basa sulla premessa che l'eccessiva paura può far sì che i titoli siano scambiati ben al di sotto del loro valore intrinseco (compra, extreme fear) mentre, allo stesso tempo, l'avidità sfrenata può far sì che i titoli siano offerti molto al di sopra di quanto dovrebbero valere (vendi, extreme greed). Alcuni scettici ritengono che l'indice non sia un valido strumento di investimento, in quanto incoraggia una strategia di market timing piuttosto che una strategia buy-and-hold. L'indice di paura e avidità della CNN esamina sette diversi fattori per stabilire la quantità di paura e avidità presente nel mercato. Essi sono:
1. Momentum del prezzo delle azioni — È utile osservare i livelli del mercato azionario rispetto a quelli degli ultimi mesi. Quando l'S&P500 è al di sopra della sua media mobile o dei 125 giorni di negoziazione precedenti, è un segno di slancio positivo. Se invece l'indice è al di sotto di questa media, significa che gli investitori stanno diventando nervosi. L'indice Fear & Greed utilizza il rallentamento del momentum come segnale di paura e la crescita del momentum di avidità.
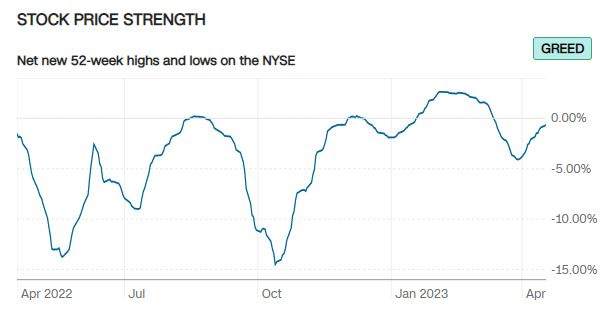
2. Stock price strength — Some large stocks can alter market returns. It is also important to know how many stocks are doing well versus those that are struggling. This shows the number of stocks on the NYSE at 52-week highs versus those at 52-week lows. When there are many more highs than lows, this is a bullish and greed signal.
2. Forza del prezzo delle azioni — Alcuni grandi titoli possono alterare i rendimenti del mercato. È importante sapere anche quanti titoli stanno andando bene rispetto a quelli in difficoltà. Questo mostra il numero di titoli del NYSE ai massimi delle 52 settimane rispetto a quelli ai minimi delle 52 settimane. Quando ci sono molti più massimi che minimi, si tratta di un segnale rialzista e di avidità.
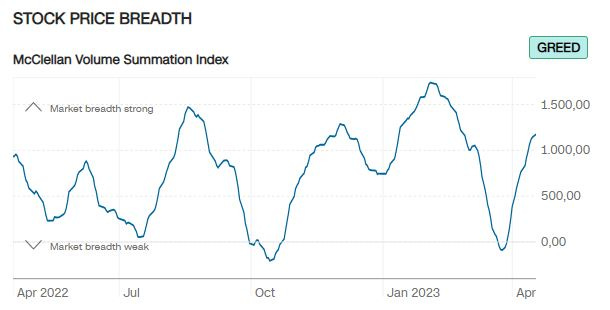
3. Breadth of share price — The market consists of thousands of shares. On any given day, investors actively buy and sell them. This measure takes into account the amount, or volume, of shares on the NYSE are rising versus the number of shares are falling. A low (or even negative) number is a bearish signal. F&G Index uses the decrease in trading volume as a fear signal.
3. Paniere del prezzo delle azioni — Il mercato è composto da migliaia di azioni. In ogni giorno, gli investitori li comprano e li vendono attivamente. Questa misura prende in considerazione la quantità, o il volume, di azioni sul NYSE che aumentano rispetto al numero di azioni che diminuiscono. Un numero basso (o addirittura negativo) è un segnale ribassista. Il Fear & Greed Index utilizza la diminuzione del volume degli scambi come segnale di paura.
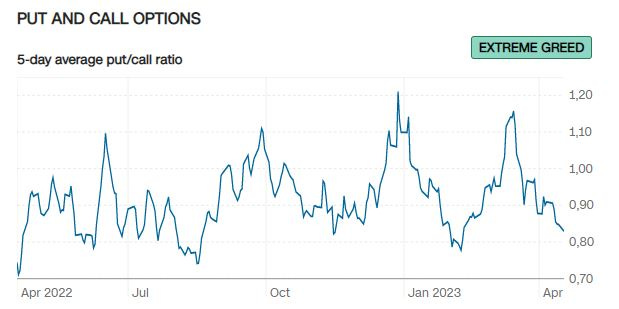
4. Put and Call Options — Options are contracts that give investors the right to buy or sell stocks, indices or other financial securities at an agreed price and date. Puts represent put option, while calls represent call option. When the ratio of puts to calls increases, it is usually a sign that investors are becoming increasingly nervous. A ratio greater than 1 is considered bearish. F&G Index uses a bearish option ratio as a signal of fear.
4. Opzioni Put e Call — Le opzioni sono contratti che danno agli investitori il diritto di acquistare o vendere azioni, indici o altri titoli finanziari a un prezzo e a una data concordati. Le put rappresentano l'opzione di vendita, mentre le call rappresentano l'opzione di acquisto. Quando il rapporto tra put e call aumenta, di solito è segno che gli investitori sono sempre più nervosi. Un rapporto superiore a 1 è considerato ribassista. Il Fear & Greed Index utilizza un rapporto di opzioni ribassista come segnale di paura.
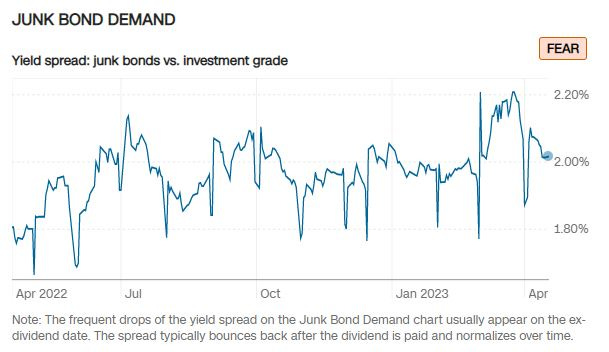
5. Demand for Junk Bonds — Junk bonds have a higher risk of default than other bonds. Bond yields, that is, the return you get from investing in a bond, fall when prices rise. If investors want junk bonds, yields fall. Similarly, yields rise when investors sell. Therefore, a smaller difference (or spread) between the yields of junk bonds and those of safer government bonds indicates that investors are taking more risk. A wider spread indicates greater caution. F&G Index uses the demand for junk bonds as a signal of greed.
5. Domanda di Junk Bond — Le obbligazioni spazzatura presentano un rischio di insolvenza più elevato rispetto alle altre obbligazioni. I rendimenti delle obbligazioni, ovvero il rendimento che si ottiene investendo in un'obbligazione, diminuiscono quando i prezzi salgono. Se gli investitori desiderano obbligazioni spazzatura, i rendimenti scendono. Allo stesso modo, i rendimenti aumentano quando gli investitori vendono. Pertanto, una differenza minore (o spread) tra i rendimenti dei titoli spazzatura e quelli dei titoli di Stato più sicuri indica che gli investitori stanno assumendo maggiori rischi. Uno spread più ampio indica una maggiore cautela. Il Fear & Greed Index utilizza la domanda di titoli spazzatura come segnale di avidità.
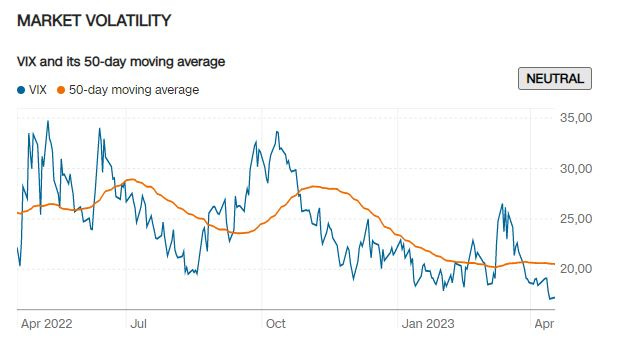
6. Market Volatility — The best known measure of market sentiment is the CBOE Volatility Index, or VIX. The VIX measures the expected price fluctuations or option volatility of the S&P500 over next 30 days. The VIX often falls on days when the general market is up and rises when stocks fall. But the key is to watch the VIX over time. It tends to be lower in bull markets and higher when bears are in control. F&G index uses increased market volatility as a signal of fear.
6. Volatilità del mercato — La misura più nota del sentiment di mercato è il CBOE Volatility Index, o VIX. Il VIX misura le fluttuazioni di prezzo previste o la volatilità delle opzioni dell'indice S&P 500 nei 30 giorni successivi. Il VIX spesso scende nei giorni in cui il mercato generale è in rialzo e sale quando le azioni crollano. Ma la chiave è osservare il VIX nel tempo. Tende ad essere più basso nei mercati toro e più alto quando gli orsi hanno il controllo. L'indice Fear & Greed utilizza l'aumento della volatilità del mercato come segnale di paura.
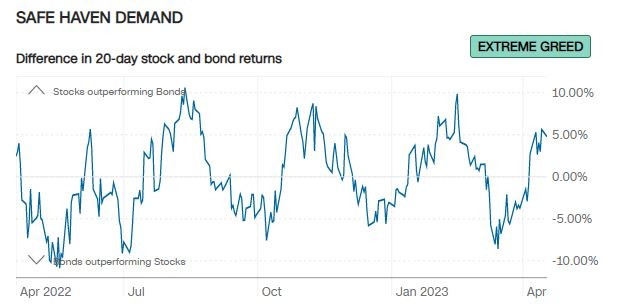
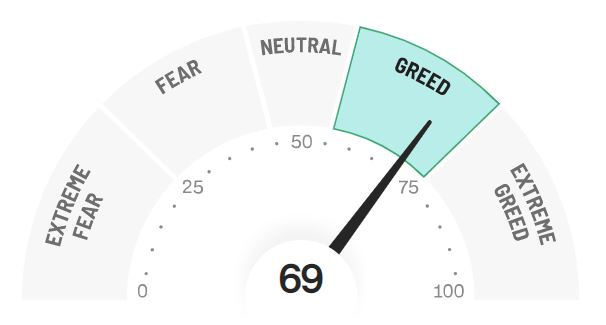
7. Demand for safe haven assets — Stocks are riskier than bonds. But reward for those who invest in stocks in the long run is greater. However, bonds can outperform stocks in short periods. The safe haven question shows the difference between Treasury bond and stock returns over the past 20 trading days. Bonds do better when investors are fearful. F&G index uses increased demand for safe haven assets as a signal of fear. Each of these seven indicators is measured on a scale of 0 to 100. The index is calculated by taking an equally weighted average of each of the indicators. A reading of 50 is considered neutral, while any higher value signals greater greed than usual.
7. Domanda di beni rifugio — Le azioni sono più rischiose delle obbligazioni. Ma la ricompensa per chi investe in azioni nel lungo periodo è maggiore. Tuttavia, le obbligazioni possono sovra-performare le azioni in periodi brevi. La domanda di rifugio sicuro mostra la differenza tra i rendimenti dei titoli del Tesoro e delle azioni negli ultimi 20 giorni di negoziazione. Le obbligazioni fanno meglio quando gli investitori sono spaventati. L'indice Fear & Greed utilizza l'aumento della domanda di beni rifugio come segnale di paura. Ognuno di questi sette indicatori è misurato su una scala da 0 a 100. L'indice viene calcolato prendendo una media equamente ponderata di ciascuno degli indicatori. Una lettura di 50 è considerata neutrale, mentre qualsiasi valore superiore segnala una maggiore avidità rispetto al solito.
Benefits of using the F&G
According to some scholars, greed can affect our brains in such a way as to force us to set aside common sense and self-control and bring about change. Although there is no generally accepted research on the biochemistry of greed, when it comes to human beings and money, fear and greed can be powerful motivators. Many investors are emotional and reactionary. Behavioral economists show decades of evidence of the effect of fear and greed on investor decisions and present a strong argument for monitoring the CNN index.
History shows that F&G Index has often been a reliable indicator of a turning point in equity markets. According to Attic Capital, the index fell to a low of 12 on September 17, 2008, when S&P500 fell to three-year lows following the failure of Lehman Brothers and the near bankruptcy of insurance giant AIG. In September 2012, however, it surpassed 90 when global stocks surged following the Federal Reserve's third round of quantitative easing.
Here is the link so you can follow the day-by-day trend:
Many experts agree that the fear and greed index is a useful indicator, as long as it is not the only tool used to make investment decisions. Investors are advised to keep an eye on fear to take advantage of buying opportunities when stocks fall and to consider periods of greed as a potential indicator of stock overvaluation. I hope you enjoyed this financial education article...see you in the next episode!
Vantaggi dell'utilizzo dell'indice di paura e avidità
Secondo alcuni studiosi, l'avidità può influenzare il nostro cervello in modo tale da costringerci a mettere da parte il buon senso e l'autocontrollo e a provocare un cambiamento. Sebbene non esistano ricerche generalmente accettate sulla biochimica dell'avidità, quando si tratta di esseri umani e di denaro, la paura e l'avidità possono essere potenti motivatori. Molti investitori sono emotivi e reazionari. Gli economisti comportamentali mostrano decenni di prove dell'effetto della paura e dell'avidità sulle decisioni degli investitori e presentano un forte argomento per il monitoraggio dell'indice della CNN.
La storia dimostra che l'indice della paura e dell'avidità è stato spesso un indicatore affidabile di una svolta nei mercati azionari. Secondo Attic Capital, l'indice è sceso a un minimo di 12 il 17 settembre 2008, quando l'S&P500 è sceso ai minimi di tre anni in seguito al fallimento di Lehman Brothers e al quasi fallimento del gigante assicurativo AIG. Nel settembre 2012, invece, ha superato il valore di 90, quando le azioni globali si sono impennate in seguito al terzo round di quantitative easing della Federal Reserve.
Ecco il link per poter seguire l’andamento giorno per giorno:
Molti esperti concordano sul fatto che l'indice di paura e avidità sia un indicatore utile, a condizione che non sia l'unico strumento utilizzato per prendere decisioni di investimento. Si consiglia agli investitori di tenere sotto controllo la paura per sfruttare le opportunità di acquisto quando i titoli scendono e di considerare i periodi di avidità come un potenziale indicatore di sopravvalutazione dei titoli. Spero che questo articolo di educazione finanziaria sia stato di tuo gradimento…ci vediamo al prossimo episodio!


