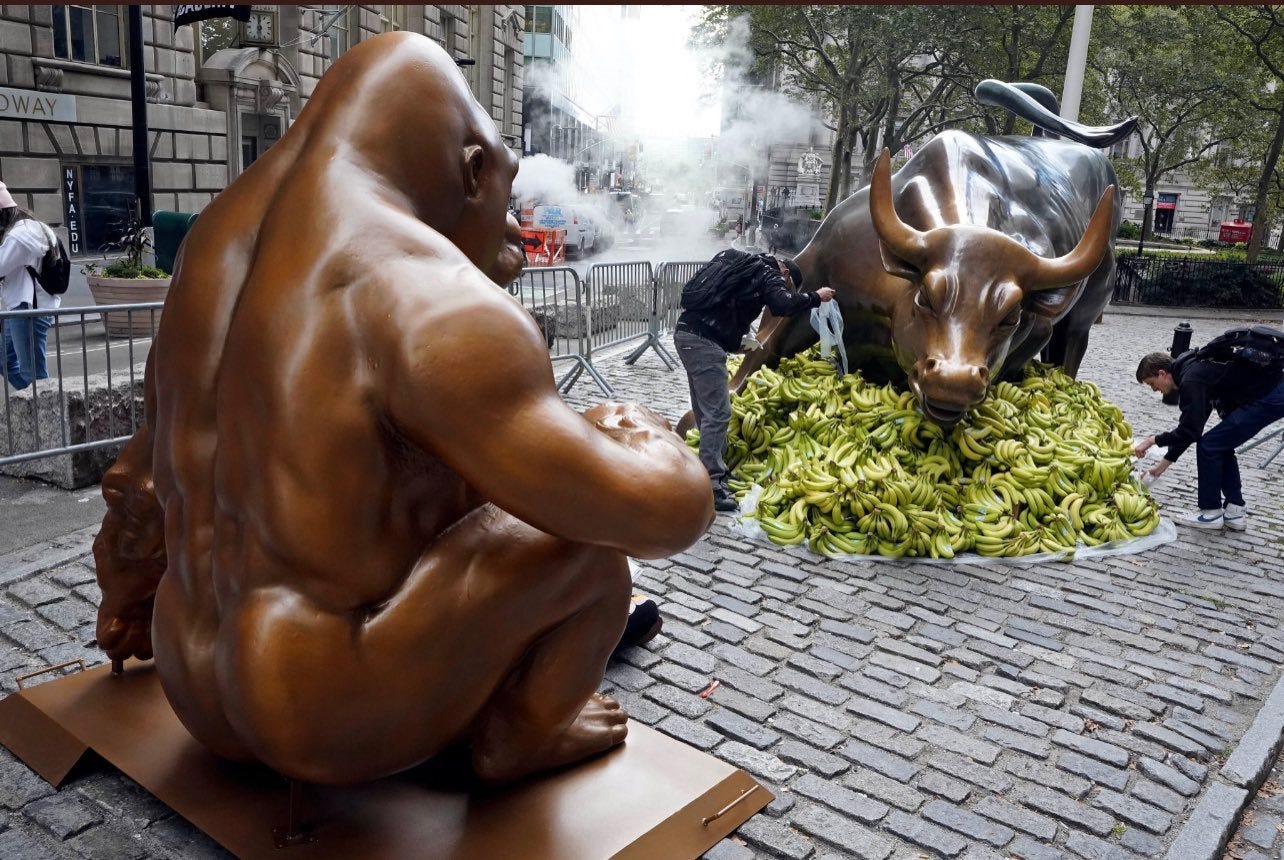
The Bull, Gorilla & Bananas
A curious case occurs today on Wall Street on the day of a strange anniversary
«Losing happens to me on a regular basis as a trader, but my focus remains on finding ways to win. When losing takes control of your emotions, market takes from you. Acceptance of loss is not weakness, its a strength so you can remain the trading game to keep fighting. Never stop» — Mirko Milito
After «Apple Time» came «Banana Time» on Wall Street. The prank was staged by Sapienz.Network who used Harambe symbol to represent the millions of people struggling under a U.S. capitalist system that they say «enriches the wealthy elites and leaves the average person behind». All of this is happening at the same time as an incredible recovery in the US stock market led by usual big 5, while Bitcoin reaches and surpasses an all-time high on the news of SEC introducing into ETF market, the one on Bitcoin called $BTFD.
When people talk about Bitcoin on social networks, in newspapers and on TV, that's the moment when the «big players» pull all the clueless investors into their net, be careful!
Dopo «Il Tempo delle Mele» è arrivato «il Tempo delle Banane» a Wall Street. Lo scherzo è stato messo in scena da Sapienz.Network che hanno usato il simbolo di Harambe per rappresentare i milioni di persone che lottano sotto un sistema capitalista statunitense che dicono «arricchisce le élite ricche e lascia indietro la persona media». Tutto questo avviene in concomitanza con un recupero incredibile del mercato azionario statunitense guidato dalle solite big 5, mentre il Bitcoin raggiunge e supera di slancio il massimo storico sulle notizie della SEC che introducono nel mercato degli ETF, quello sul Bitcoin denominato $BTFD.
Quando sui social network, sui giornali e in TV si parla di Bitcoin, è quello il momento in cui i «grossi operatori» tirano nella loro rete tutti gli investitori sprovveduti, fate attenzione!
Everything changes but nothing changes
Another curious date this week is the anniversary of the 1987 crash where Dow Jones lost 22.6% in a single session. The questions were asked by reporters of time were the similarities of that crash with 1929. After almost 100 years, questions and reactions of traders and financial experts are still the same.
Article of deepening on the collapse of 1987
Black Monday is the name commonly given to the global, sudden, severe, and largely unexpected stock market crash on October 19, 1987. In Australia and New Zealand, the day is also referred to as Black Tuesday because of the time zone difference from other English-speaking countries. All of the twenty-three major world markets experienced a sharp decline in October 1987. When measured in United States dollars, eight markets declined by 20 to 29%, three by 30 to 39% (Malaysia, Mexico and New Zealand), and three by more than 40% (Hong Kong, Australia and Singapore). The least affected was Austria (a fall of 11.4%) while the most affected was Hong Kong with a drop of 45.8%. Out of twenty-three major industrial countries, nineteen had a decline greater than 20%. Worldwide losses were estimated at US$1.71 trillion. The severity of the crash sparked fears of extended economic instability or even a reprise of the Great Depression.
Read the box below carefully — doesn't it look like today?
The degree to which the stock market crashes spread to the wider economy (or «real economy») was directly related to the monetary policy each nation pursued in response. The central banks of the United States, West Germany and Japan provided market liquidity to prevent debt defaults among financial institutions, and the impact on the real economy was relatively limited and short-lived. However, refusal to loosen monetary policy by the Reserve Bank of New Zealand had sharply negative and relatively long-term consequences for both financial markets and the real economy in New Zealand.
The crash of 1987 also altered implied volatility patterns that arise in pricing financial options. Equity options traded in American markets did not show a volatility smile before the crash but began showing one afterward.
Tutto cambia ma niente cambia
Altra data curiosa di questa settimana è la ricorrenza della caduta del 1987 dove il Dow Jones perse il 22.6% in una sola seduta. Le domande che si ponevano i cronisti dell’epoca erano le analogie di quel crash con quello del 1929. Dopo quasi 100 anni le domande e le reazioni degli operatori ed esperti finanziari sono sempre le stesse.
Articolo di approfondimento sul crollo del 1987
Lunedì nero è il nome comunemente dato al crollo globale, improvviso, grave e in gran parte inaspettato del mercato azionario il 19 ottobre 1987. In Australia e Nuova Zelanda, il giorno è anche indicato come martedì nero a causa della differenza di fuso orario rispetto agli altri paesi di lingua inglese. Tutti i ventitré principali mercati mondiali hanno sperimentato un forte calo nell'ottobre 1987. Misurati in dollari statunitensi, otto mercati sono diminuiti dal 20 al 29%, tre dal 30 al 39% (Malesia, Messico e Nuova Zelanda) e tre da più del 40% (Hong Kong, Australia e Singapore). Il meno colpito è stato l'Austria (un calo dell'11,4%) mentre il più colpito è stato Hong Kong con un calo del 45,8%. Su ventitré grandi paesi industriali, diciannove hanno avuto un calo superiore al 20%. Le perdite mondiali sono state stimate in 1,71 trilioni di dollari. La gravità del crollo ha scatenato i timori di una prolungata instabilità economica o addirittura di una ripresa della Grande Depressione.
Leggi attentamente il riquadro qui sotto: non ti sembra oggi?
Il grado in cui il crollo del mercato azionario si diffuse all'economia più ampia (o «economia reale») fu direttamente collegato alla politica monetaria che ogni nazione perseguì in risposta. Le banche centrali degli Stati Uniti, della Germania occidentale e del Giappone fornirono liquidità al mercato per prevenire le insolvenze delle istituzioni finanziarie, e l'impatto sull'economia reale fu relativamente limitato e di breve durata. Tuttavia, il rifiuto di allentare la politica monetaria da parte della Reserve Bank of New Zealand ebbe conseguenze fortemente negative e relativamente a lungo termine sia per i mercati finanziari che per l'economia reale in Nuova Zelanda.
Il crollo del 1987 ha anche alterato i modelli di volatilità implicita che sorgono nel pricing delle opzioni finanziarie. Le opzioni azionarie scambiate nei mercati americani non mostravano un sorriso di volatilità prima del crollo, ma iniziarono a mostrarne uno dopo.
Despite inflation ECB continue to buy
The European Central Bank's balance sheet continues to rise despite rising inflationary pressure. Total assets increased by another €22.4 billion to reach new ATH at €8,336.7 billion; the EBC balance sheet is now 77% of Eurozone GDP compared to 37% for the US, 38% for the BoE and 133% for the BoJ.
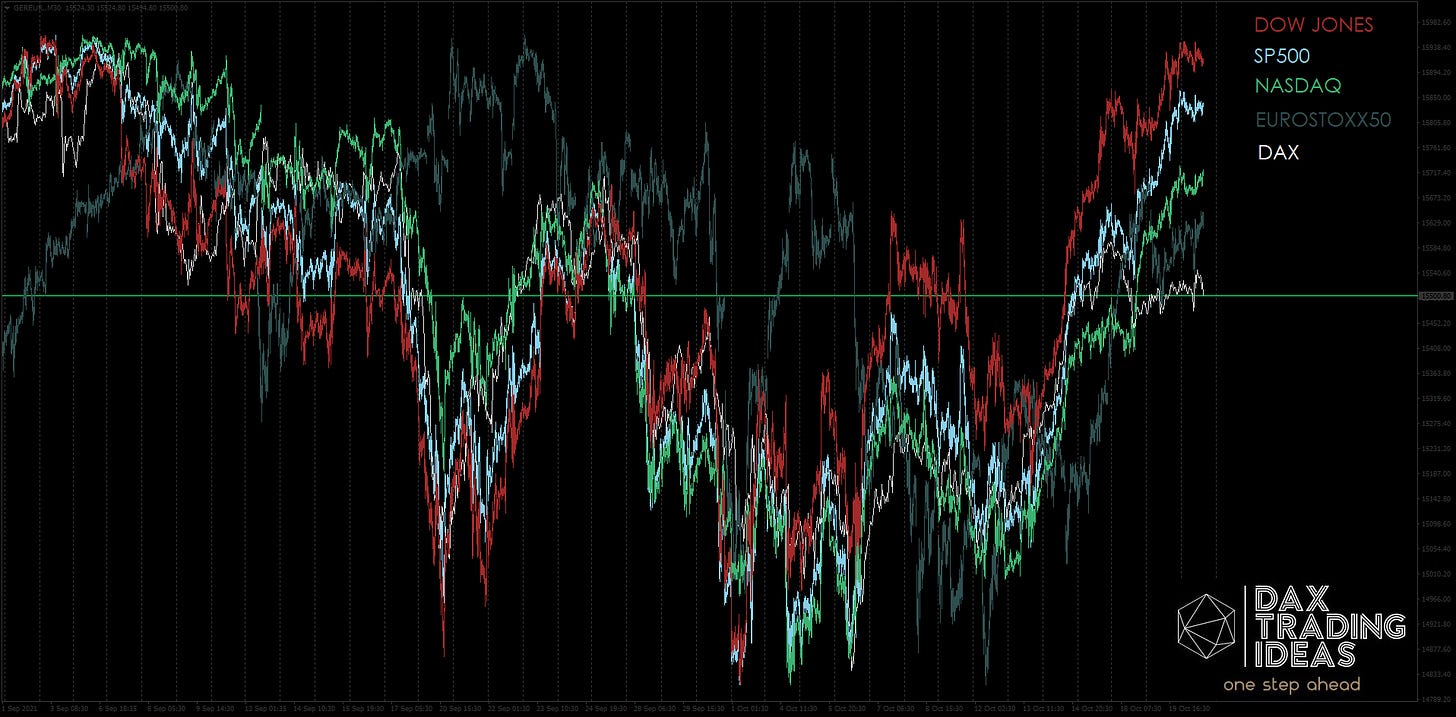
Apart from the incredible recovery of Wall Street partially followed by other stock indices, in Europe situation is not the best despite all this euphoria. Yesterday, inflation data in Germany reached very high levels: PPI rose by 14.2% in September (year-on-year) driven mainly by energy prices, the highest increase since October 1974 (+14.5%) , when prices rose sharply during the first oil crisis.
DAX the weakest of the indices remains stranded in 15500 area. Technically there is nothing new to report, if you missed the Newsletter with all exactly levels we invite you to read it again here. In summary we can expect weakness for this weekend on the German index with a target area identified at 15380, in extension 15260/240. On the upside we always have support area 15600/630: barriers in options are always on the levels reported in previous weeks at 15690 | 15790 | 15890.
Nonostante l’inflazione BCE continua a comprare
Il bilancio della Banca Centrale Europea continua a salire nonostante l'aumento della pressione inflazionistica. Il totale delle attività è aumentato di un altro € 22,4 miliardi per raggiungere nuovi ATH a € 8.336,7 miliardi; il bilancio di EBC è ora pari al 77% del PIL dell'Eurozona contro il 37% degli Stati Uniti, il 38% della BoE e il 133% della BoJ.
A parte l’incredibile recupero di Wall Street parzialmente seguito dagli altri indici azionari, in Europa la situazione non è delle migliori nonostante tutta questa euforia. Ieri i dati sull’inflazione in Germania hanno raggiunto livelli altissimi: il PPI è aumentato del 14,2% a settembre (anno su anno) guidato principalmente dai prezzi dell'energia, l'aumento più alto da ottobre 1974 (+14,5 %) , quando i prezzi sono aumentati fortemente durante la prima crisi petrolifera.
DAX il più debole tra gli indici rimane incagliato nell’area 15500. Tecnicamente non ci sono novità da segnalare, se ti sei perso la Newsletter con tutti i livelli precisi ti invitiamo a rileggerla qui. In sintesi possiamo attenderci debolezza per questo fine settimana sull’indice tedesco con un’area target identificata a 15380, in estensione 15260/240. Al rialzo abbiamo sempre l’area supportiva 15600/630: le barriere in opzioni le troviamo sempre sui livelli segnalati le settimane precedenti a 15690 | 15790 | 15890.


