Still Don't Let Up
Bonds led recovery in the trend that still persists, while central banks did not stop hitting the market
«Tension is a traders worst enemy for me, tighter my grip is on trying to control outcomes the further I get from the outcomes I want. We can only push ourselves so far before we become counter productive. Have self awareness & know when breaks are productive» — Mirko Milito
New week and new round of buying on the markets by central banks. Since October 12th all markets have started in unison: bonds have led recovery of the trend that still persists, followed by stock markets, currencies and crypto. Central banks have not stopped hitting the market, despite the fact that we are on eve of the start of tapering in the US by Federal Reserve and ECB, which should also announce something this week. Our trend indicator that we constantly monitor on the main markets are signaling precisely these trends (red arrows).
The long-term weekly chart confirms there is reluctance to move away from all-time high in the psychological area of 16000 points. The low was created a few weeks ago in our opinion will not be left for too long without being revised. A healthy and mature market to be able to give life to a rally at the end of the year would deserve a massive correction that however would not affect long-term trend. The levels we have identified for many months are 13826 and 13578, which is the median of bullish channel in which are and the support area where can bounce. According to our estimates from the current levels (15500) can expected decline of over 10%. A bull market like this could have a daily decline of 1/2 percentage points, with extreme peaks of 3/5%. So we don’t believe this year will be tested the levels indicated but they can be «floor» points to be used in 2022.
Nuova settimana e nuovo giro di acquisti sui mercati da parte delle banche centrali. Dal 12 Ottobre sono partiti all'unisono tutti i mercati: i bonds hanno guidato la ripresa del trend che ancora persiste, hanno seguito i mercati azionari, le valute e le crypto. Le banche centrali non hanno smesso di colpire il mercato, nonostante siamo alla vigilia dell'inizio del tapering in US da parte della FED e dalla BCE che questa settimana dovrebbe annunciare qualcosa anch'essa. Il nostro indicatore di trend che monitoriamo costantemente sui principali mercati ci segnalano appunto queste tendenze (frecce rosse).
Il grafico settimanale di lungo periodo ci conferma che c'è riluttanza ad allontanarsi dal massimo storico sull'area psicologica dei 16000 punti. Il minimo che è stato creato alcune settimane fa a nostro avviso non sarà lasciato per troppo tempo senza essere rivisto. Un mercato sano e maturo per poter dar vita ad un rally di fine anno meriterebbe una correzione imponente che comunque non intaccherebbe il trend di lungo periodo. I livelli che abbiamo identificato già da molti mesi sono le zone 13826 e 13578 che è anche la mediana del canale rialzista in cui stiamo lavorando e la zona di supporto dove poter rimbalzare. Facendo due calcoli dai livelli attuali (15500) parliamo di un ribasso atteso di oltre il 10%. Un mercato toro come questo potrebbe avere un ribasso giornaliero di 1/2 punti percentuali, con punte estreme del 3/5%. Quindi non crediamo che quest'anno verranno testati i livelli indicati ma possano essere dei punti «pavimento» da utilizzare nel 2022.
Volatility and Master Time Cycle Levels
Weekly trading levels on DAX Index based on the Master Time Cycle method:
Closing price: 15600
Resistances: 15620 | 15740 | 15860 | 15981
Supports: 15500 | 15379 | 15259 | 15138
Bitcoin aside, equity markets are quiet as a volatility index. Earlier this week we noticed interesting movements on the Euro/Dollar that are primarily attributable to a return of dollar strength.
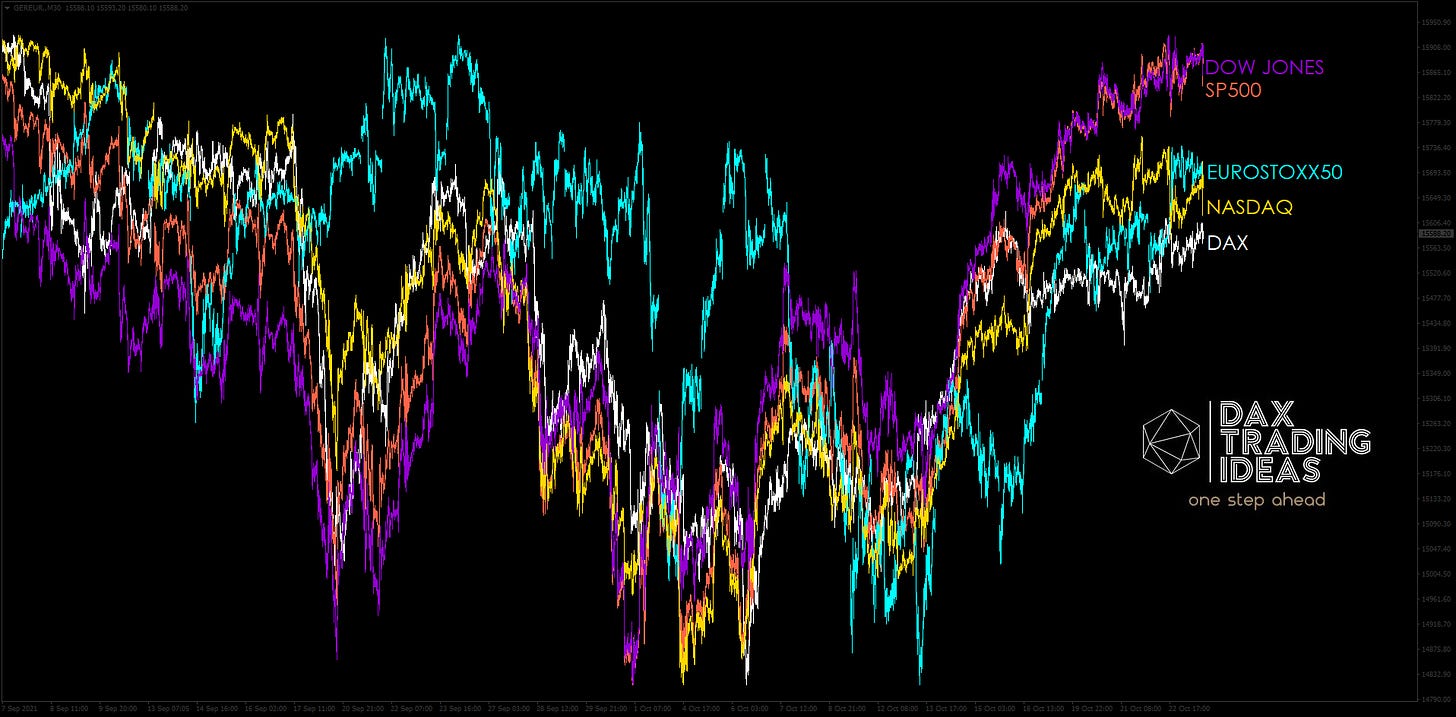
The relative strength index of equity indices still signals DAX as the last in line. This week we had the Nasdaq falling to keep it company while the Dow Jones and SP500 rise in tandem. At the moment from historical highs is all, the next appointment: good trading to all and subscribe to receive updates in your email, it will be the only way to receive it!
Volatilità e livelli del Master Time Cycle
Livelli di trading settimanali sul DAX basati sul metodo “Master Time Cycle”:
Prezzo di chiusura: 15600
Resistenze: 15620 | 15740 | 15860 | 15981
Supporti: 15500 | 15379 | 15259 | 15138
Bitcoin a parte, i mercati azionari sono tranquilli come indice di volatilità. Ad inizio di questa settimana abbiamo notato movimenti interessanti sull'Euro/Dollaro che sono principalmente attribuibili ad un ritorno di forza del dollaro.
L'indice di forza relativa degli indici azionari segnala ancora il DAX come l'ultimo della fila. Questa settimana abbiamo avuto il Nasdaq che è sceso a farlo compagnia, mentre Dow Jones ed SP500 salgono di pari passo. Al momento dai massimi storici è tutto, al prossimo appuntamento: buon trading a tutti e iscrivetevi per ricevere gli aggiornamenti nella tua mail, sarà l'unico modo per poterla ricevere!


