How To Use Moving Averages
An effective and unconventional introductory guide on how to use moving averages on the chart that make sense
Welcome back to all traders and investors of Dax Trading Ideas. From time to time we take chance to say thank you to readers and followers of our project: all this exists because of you. If you haven't done so yet, we recommend you to follow us every day on Twitter and Telegram where we constantly publish charts, analysis and insights. In addition, if you wish to receive the weekly Newsletter includes unconventional analysis with Master Time Cycle method, trading levels on DAX, level-headed research and macro-insights, sign up from the link below. It's a contribution helps us do our best every day and provide the best content possible. You can always get lies for free: truth costs a few bucks, but in the long run it’s much cheaper.
Bentornati a tutti i traders e investitori di Dax Trading Ideas. Di tanto in tanto approfittiamo di questo spazio aperto per ringraziare i lettori e sostenitori del nostro progetto: tutto questo esiste grazie a voi. Se ancora non lo avete fatto vi consigliamo di seguirci tutti i giorni su Twitter e Telegram dove pubblichiamo costantemente grafici, analisi e approfondimenti. Inoltre se desideri ricevere la Newsletter settimanale che comprende analisi non convenzionali con il metodo Master Time Cycle, livelli operativi sul DAX, ricerche di alto livello e macro-insights, iscriviti dal link qui sotto. E’ un contributo che ci aiuta a fare del nostro meglio ogni giorno e fornire il miglior contenuto possibile. Le bugie si trovano sempre gratis: la verità costa qualche soldo, ma alla lunga è molto più economica.
The 200-period moving average
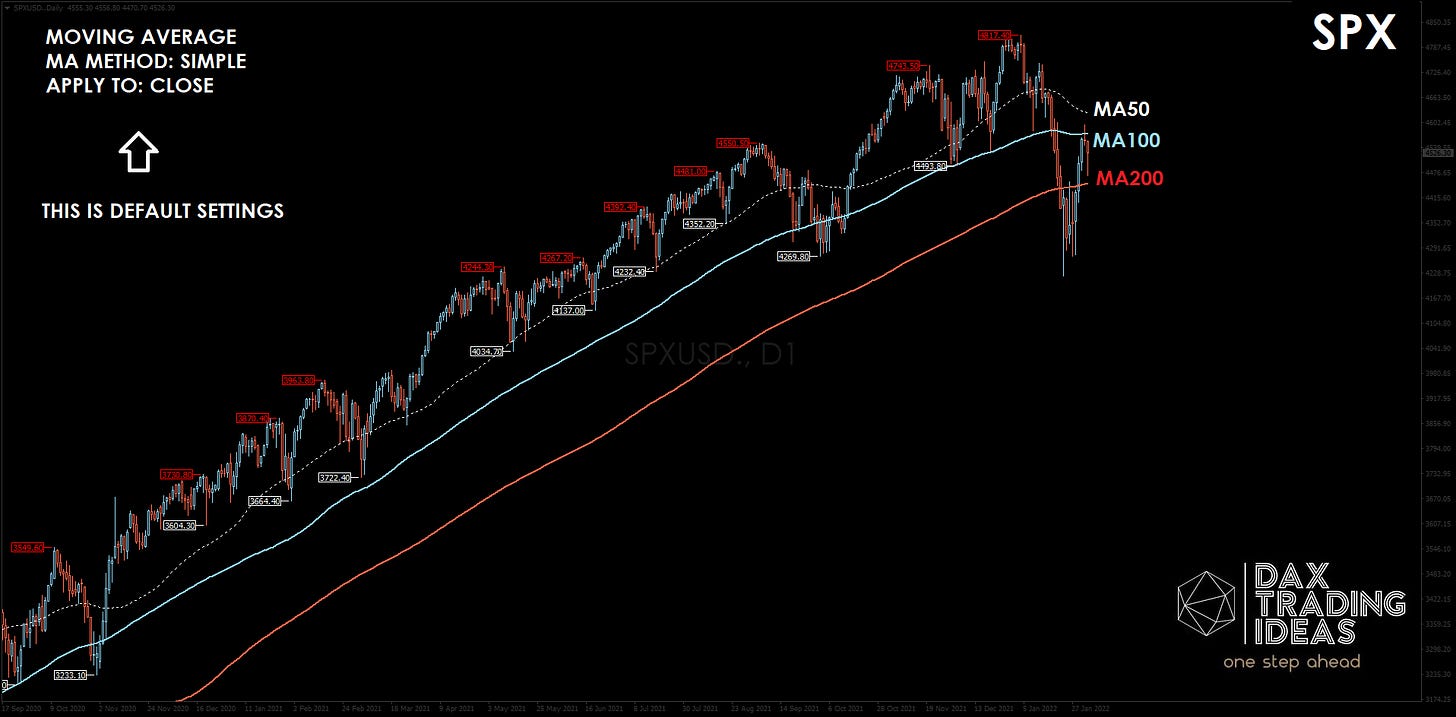
Story-telling of trading online is addicted to the use of any indicator or oscillator to be put on the chart: moving averages are among them. From a technical point of view using 50, 100 or 200-period moving average makes no sense and I will explain why. If you open every social profile of some analyst/economist/trader, they have a chart represented by price and one or more moving averages. Moving within various time compressions (minute-day-week), moving average is continuously recalculated automatically without considering the real reason why it is there. Representing 200 minutes, 200 hours or 200 days on the chart does not give us any more information than we already have. Fact that price is above or below the average or even better comes at touches, in concrete, what advantage does it provide?
La media mobile a 200 periodi
Lo story-telling del trading online è assuefatto dall’utilizzo di qualsiasi indicatore o un oscillatore da inserire sul grafico: le medie mobili sono tra queste. Dal punto di vista tecnico utilizzare la media mobile a 50, 100 o 200 periodi non ha alcun senso e vi spiego il perchè. Se aprite un profilo social di qualche analista/economista/trader, hanno un grafico rappresentato dal prezzo e da una o più medie mobili. Muovendoci all’interno delle varie compressioni temporali (minuto-giorno-settimana), la media mobile viene ricalcolata continuamente in automatico senza tener conto il vero motivo per cui è lì . Rappresentare 200 minuti, 200 ore o 200 giorni sul grafico non ci restituisce alcuna informazione in più rispetto a quelle già in nostro possesso. Il fatto che il prezzo sia sopra o sotto la media o che venga a contatto con la media stessa, in termini pratici, quale vantaggio fornisce?
If it doesn’t have advantage, don’t use it
Any indicator we place on the chart must return an advantage. Literally is «someone or something placed in a favorable position relative to another». Going back to what was said earlier, if everyone is using 200 moving average on the daily chart there is no trading advantage. If you were a hedge fund and you knew that everyone was using the moving average what would you do? We would do exact opposite! That's why in this article we will not tell you which are moving averages we use on the chart (basically 3) but this article is written to stimulate and put on your shoulder, talking cricket that will repeat every day: study, learn, try, fail, try again.
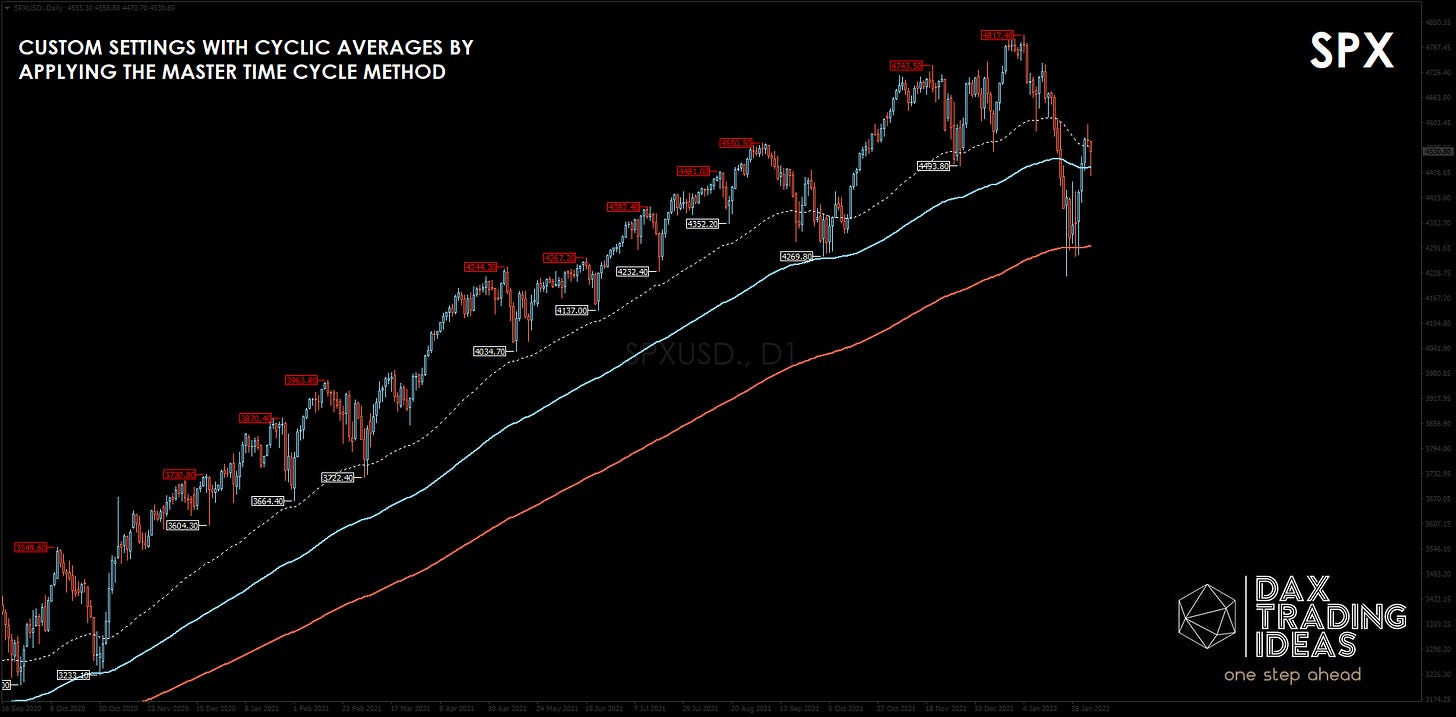
A hint that we can give is to use things according to logic, has a link between Time and Price. Those who have been following us for years know very well that we spend most of our time in the analysis and study of these two fundamental factors to try to understand market scenarios. According to our analysis methods we can establish that a moving average makes sense if it represents a given time period, below you will find a practical example that we ask you to compare with the previous chart.
Se non ha un vantaggio oggettivo, non utilizzarla
Qualsiasi indicatore che inseriamo sul grafico deve restituirci un vantaggio. Il vantaggio letteralmente è «qualcuno o qualcosa posto in posizione favorevole rispetto ad un altro». Tornando a quello che è stato detto poco fa, se tutti utilizzano la media 200 periodi sul grafico giornaliero non c’è alcun vantaggio operativo. Se voi foste un hedge fund e sapeste che tutti utilizzano la media mobile cosa fareste? Noi faremmo l’esatto contrario! Ecco perchè in questo articolo non vi diremo quali sono le medie mobili che noi utilizziamo sul grafico (tendenzialmente 3) ma questo articolo è scritto per stimolare e mettere sulla vostra spalla, il grillo parlante che vi ripeterà ogni giorno: studia, impara, prova, sbaglia, riprova.
Un indizio che possiamo dare è di utilizzare le cose secondo logica e che abbia un legame tra Tempo e Prezzo. Chi ci segue da anni sa benissimo che dedichiamo la maggior parte del tempo nelle analisi e nello studio di questi due fattori fondamentali per cercare di interpretare gli scenari di mercato. In base ai nostri metodi di analisi possiamo stabilire che una media mobile ha senso se rappresenta un dato periodo di tempo, qui sopra troverai un esempio pratico che vi chiediamo di comparare con il grafico precedente.
2 questions, 1 answer
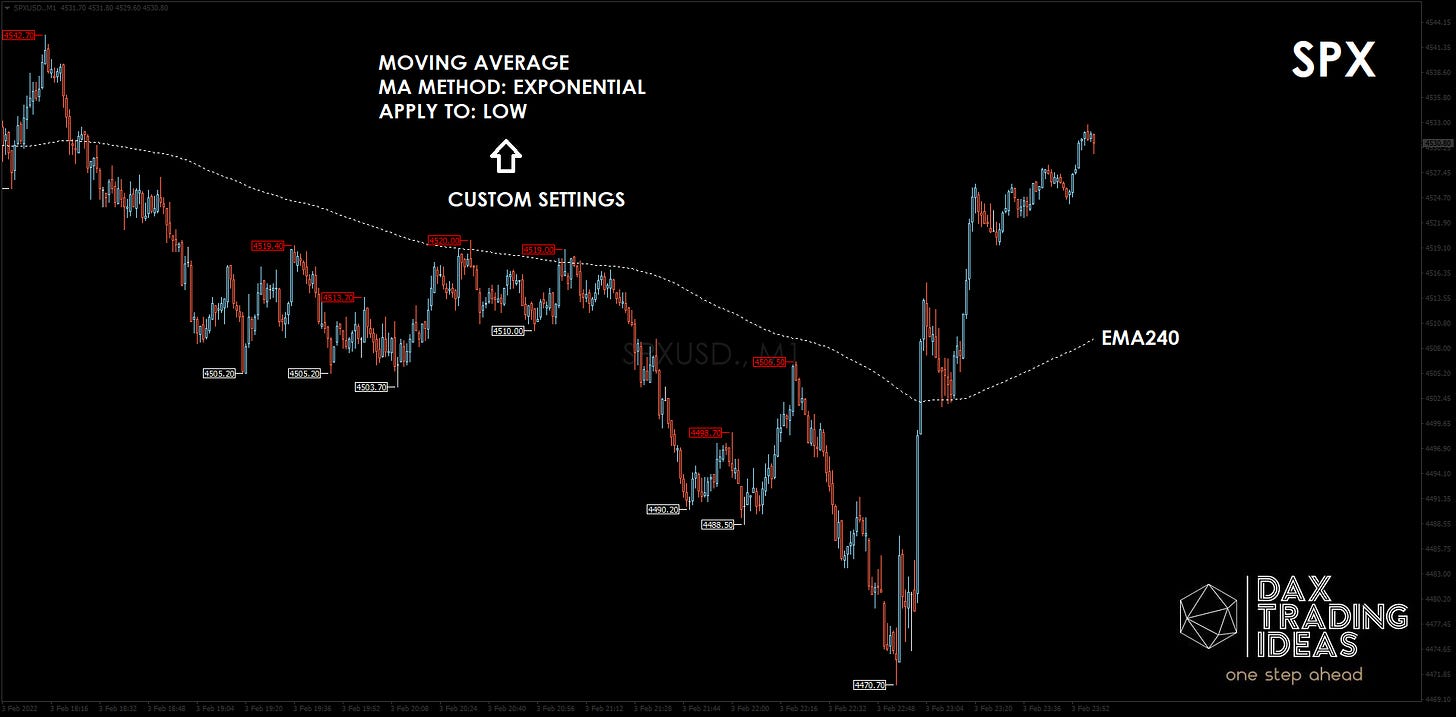
If I’m analyzing SP500 1 minute chart and looking for trading ideas, I will apply a moving average showing trend over last 4 hours. What to do now? We will have to convert hours into minutes (4x60 = 240 minutes) and divide result by the chosen time frame (240/1 = 240 periods). We will need to apply it to 1-minute chart and it will represent 4-hour average trend on the chart. After doing this, we are faced with another fork in the road:
does it make sense to have this information?
simple or exponential average?
The first answer is obvious and simple but complicated in the application: depends. It depends on how to use information and on tests done observing market behavior. For example the average could be used as a bullish sentiment (below price) and bearish sentiment (above price), or as a trigger at the touch of MA. The second question simple or exponential depends on sensitivity of the trader: we prefer to use exponential average because in our opinion it is more useful to give weight to the last movements. An investor who observes a weekly or monthly chart would not have these problems and can easily use a simple average.
An advice we can give you from someone who has been studying market cycles for almost 10 years is to apply MA not at the close but at bottom (apply to low). This is because market cycle always starts from a low: combining these two information (low + exponential) will give an application on the chart more appropriate with market trend. We sincerely hope this article has been useful and stimulated the idea of deepening study of the market with daily observation: it’s the only way we know to achieve results. If you liked this article we invite you to share it with your friends, it will not cost you anything but will be of great help to our work...see you next episode!
2 domande, 1 risposta
Se sto analizzando il grafico dell’SP500 a 1 minuto e sto cercando idee operative, applicherò una media mobile che mostri l’andamento medio delle ultime 4 ore. Cosa fare quindi? Bisognerà trasformare le ore in minuti (4x60 = 240 minuti) e dividere il risultato per il time-frame scelto (240/1 = 240 periodi). Dovremo quindi applicarla al grafico a 1 minuto e rappresenterà l’andamento medio a 4 ore sul grafico. Dopo aver fatto questo, siamo di fronte ad un ulteriore bivio:
ha senso avere questa informazione?
media semplice o esponenziale?
La prima risposta è scontata e semplice ma complicata nell’applicazione: dipende. Dipende da come utilizzare l’informazione e dai test fatti osservando il comportamento del mercato. Per esempio la media potrebbe essere utilizzata come sentiment rialzista (sotto il prezzo) e ribassista (sopra al prezzo), oppure come trigger al tocco della media. Il secondo quesito semplice o esponenziale dipende dalla sensibilità del trader: preferiamo utilizzare la media esponenziale perchè a nostro parere è più utile dare peso agli ultimi movimenti. Un investitore che osserva un grafico settimanale o mensile non avrebbe di questi problemi e potrà tranquillamente utilizzare una media semplice.
Un consiglio che possiamo darvi da chi studia i cicli di mercato da quasi 10 anni è quella di applicare la media non alla chiusura ma al minimo (apply to low). Questo perchè il ciclo di mercato parte sempre da un minimo: combinare queste due informazioni (media dal minimo + esponenziale) darà un’applicazione sul grafico più congrua con l’andamento del mercato. Speriamo sinceramente che questo articolo vi sia stato utile e abbia stimolato l’idea di approfondire lo studio del mercato con l’osservazione giornaliera: è l’unica strada che conosciamo per raggiungere dei risultati. Se questo articolo vi è piaciuto vi invitiamo a mettete mi piace e condividete con i vostri amici, non vi costerà nulla ma potrà essere di grande aiuto al nostro lavoro…al prossimo episodio!


Thank you for sharing, your article has given me inspiration to be able to better study how to apply moving averages on my chart.
Please feel free to leave questions, comments and feedback here. Hope you all enjoyed it!