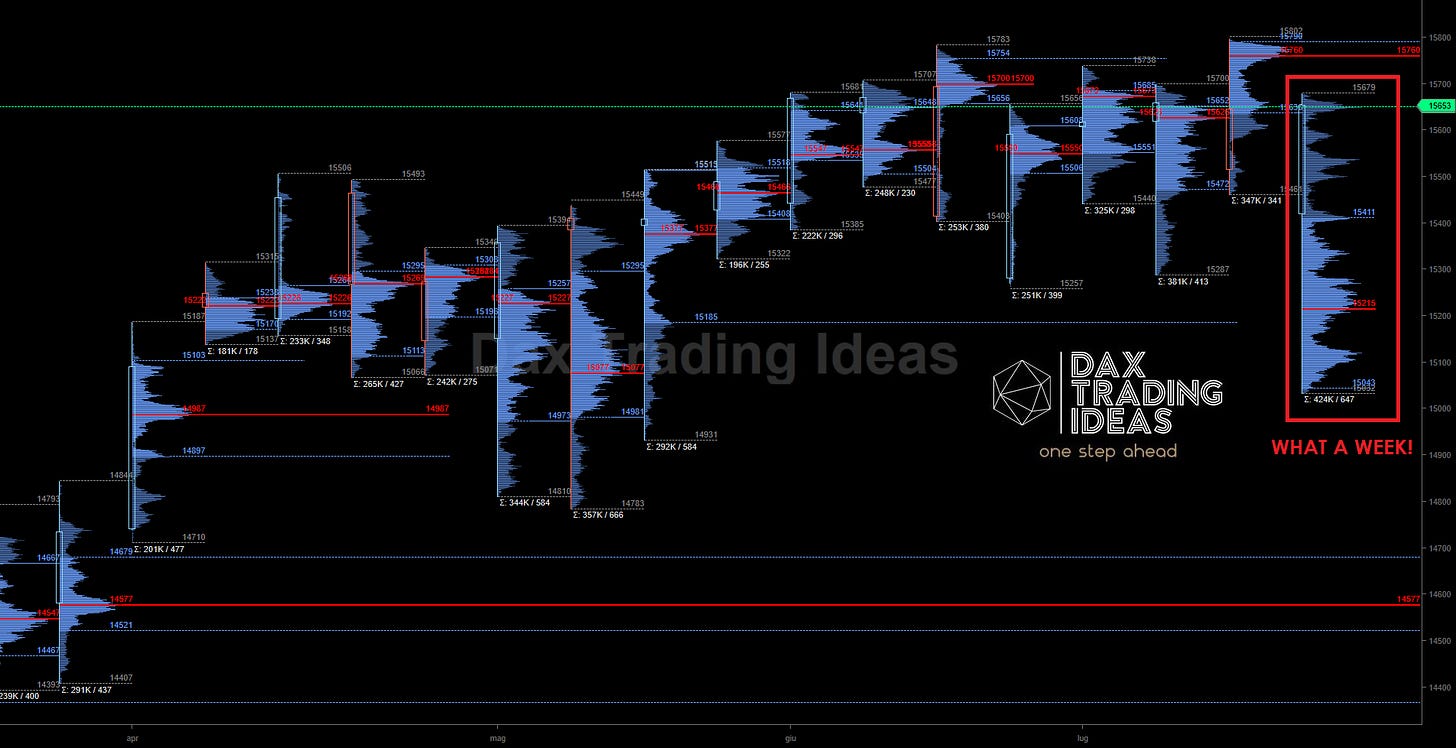
Incredible week we put behind us, but equally exciting will be this one about to begin. There are many topics that will discuss in these days, starting with earning reports in the US, but let's take a step back first and analyze what happened, starting with the DAX. In the chart that you can see is represented weekly candle that has scored 647 points of range and 424k volumes: from impressive decline on Monday almost all the volumes and oscillation has been made to the upside, leaving behind a scary «shadow» proves once again, the enormous liquidity is ready to be placed on the financial markets. Attack to the new historical highs is imminent but be careful to the resistance 15760: fake breakouts could make bullish stumble and buy everything in front of them. Only closures above would give new upward thrust and a strong bullish signal.
Settimana incredibile quella che ci mettiamo alle spalle, ma altrettanto entusiasmante sarà questa che sta per cominciare. Numerosi i temi che affronteremo in questi giorni a partire dalle trimestrali negli USA, ma facciamo un passo indietro prima e analizziamo quello che è successo, a partire dal DAX. Nel grafico che potete osservare è rappresentata la candela settimanale che ha totalizzato 647 punti di range e 424k volumi: dal ribasso imponente del lunedì quasi tutti i volumi e l'oscillazione è stata fatta al rialzo, lasciando alle spalle una «shadow» spaventosa che prova ancora una volta, l'enorme liquidità che è pronta ad essere immessa sui mercati finanziari. L'attacco ai nuovi massimi storici è imminente ma attenzione alla resistenza 15760: i falsi breakout potrebbero far inciampare i rialzisti che comprano tutto quello che capita davanti. Soltanto chiusure al di sopra darebbero nuova spinta al rialzo e un forte segnale bullish.
The long term chart doesn’t lie
After hitting all-time high at 15805 retracement was powerful and sudden, a clear sign that technicals were respected (this time too). The first long term support areas are located between 13905 and 13826, extremely far from where we are now so bullish trend is confirmed until proven otherwise. As the weeks go by, median and floors will rise but for intraday traders it is desirable to stay with this volatility and wide ranges: they are the best part of trading!
Il grafico di lungo periodo non mente
Dopo aver messo a segno il massimo storico a 15805 il rintracciamento è stato potente e improvviso, segnale evidente che la tecnicalità è stata rispettata (anche questa volta). Le prime aree supportive di lungo periodo sono posizionate tra 13905 e 13826, estremamente lontane da dove siamo adesso quindi il trend bullish è confermato fino a prova contraria. Man mano che passeranno le settimane, la mediana e i pavimenti si alzeranno ma per i traders intraday è auspicabile rimanere con questa volatilità e range ampi: sono il sale del trading!
In the short term something might happen
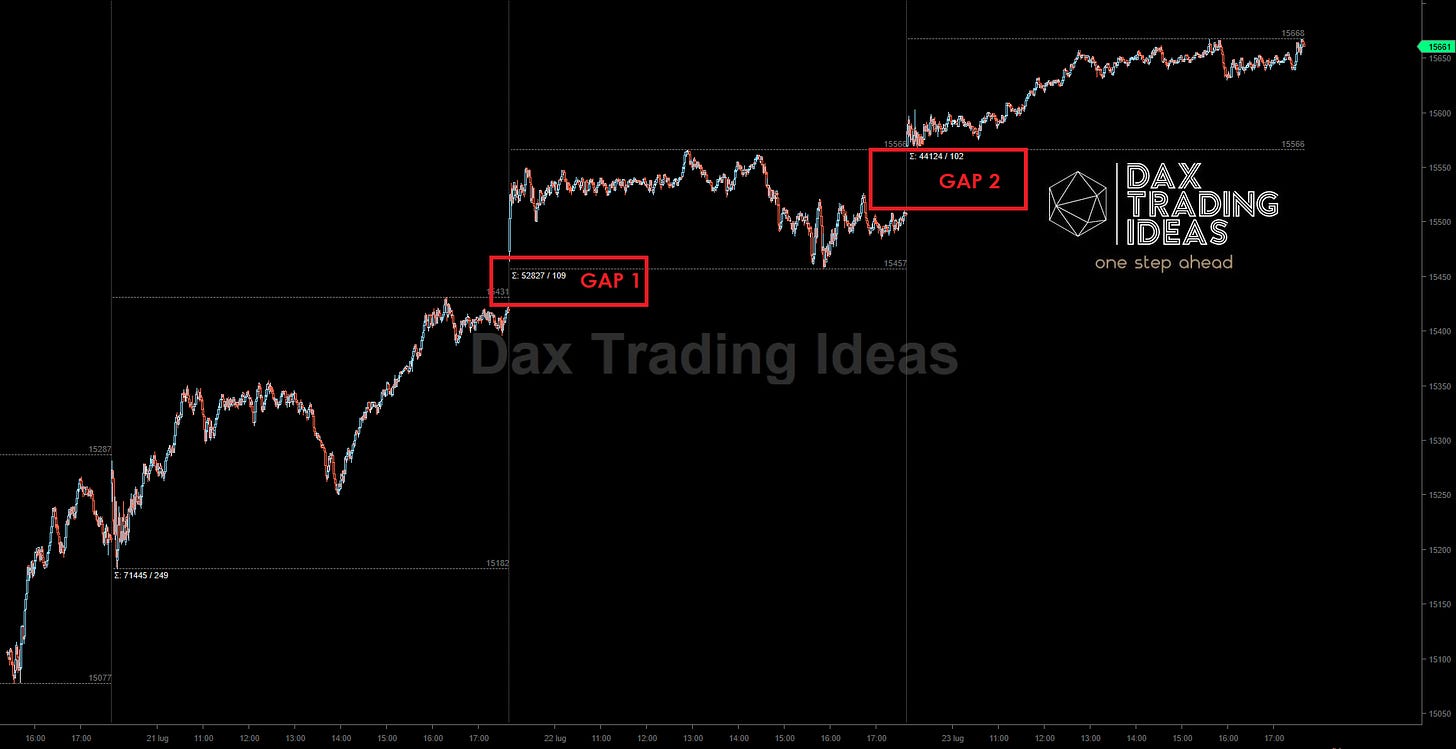
We can expect physiological declines in the short term: we left open two intraday gaps from cash session on the DAX: 15550 - 15500 and 15450 - 15400 are working zones for buy on dip opportunities. From cyclical point of view, time would be again ripe for a very short term reversal, especially after an uptrend made in this way. The markets as usual are made to surprise us so always focused and alert!
Nel breve termine qualcosa potrebbe accadere
Possiamo aspettarci dei ribassi fisiologici nel breve periodo: abbiamo lasciato aperti due gap intraday della sessione cash sul DAX: 15550 - 15500 e 15450 - 15400 sono zone di lavoro per opportunità di buy on dip. Dal punto di vista ciclico i tempi sarebbero nuovamente maturi per un inversione di brevissimo periodo, in particolare dopo una risalita fatta in questo modo. I mercati come al solito sono fatti per sorprenderci quindi sempre focalizzati e allerta!
FAANGMAN always dominates, especially these days
The best US companies will dominate future of markets, this is very clear and it's best to have this in mind for next times. All major movements will start from these companies that now hold big slice of the market in almost every business. This chart highlights just that: we are at levels never seen before and they could buy entire nations if they joined forces. Situation is dangerous from the point of view of fairness and free market; by the way investor necessary to take side of the strongest if you want to try to survive, as demonstrated by long-term returns of indices (especially SPX, QQQ) and the ivalue of these companies. All in the hands of a few, sad story!
FAANGMAN dominano sempre, soprattutto in questi giorni
Le migliori aziende americane domineranno il futuro dei mercati, questo è molto chiaro ed è meglio averlo in mente per il futuro. Tutti i movimenti più importanti partiranno da queste aziende che ormai hanno in mano la grande fetta di mercato di quasi tutti i business. Questo grafico mette in risalto proprio questo: siamo su livelli mai visti prima e potrebbero comprare intere nazioni se unissero le forze. Questa situazione è allarmante da un punto di vista di equità e libero mercato; dal punto di vista dell'investitore bisogna schierarsi dalla parte del più forte se si vuol provare a sopravvivere, lo dimostrano i rendimenti nel lungo periodo degli indici (in particolare SPX, QQQ) e al valore intrinseco di queste aziende. Tutto in mano a pochi, triste storia!


