3 Steps To Survive in the Financial Markets
There would be so much more to say but when you're in confusion and don't know where to start do a Back To Basis to get started
«Don't skimp investment in trading. Greed, trying to save money, will make you lose at least ten times as much. Choose a mentor, an honest man, learn the art, take the best. Your mind and your skills will tell you if this can be your job. Work hard, every day» — Mirko Milito
These are in our opinion the 3 basic steps to understand, interpret, read and then make the mouse click within the great game of financial markets:
Cyclic Analysis (Time)
Technical Analysis (Price)
Volumes
Questi sono a nostro parere i 3 step fondamentali per capire, interpretare, leggere e quindi fare il click sul mouse all’interno del grande gioco dei mercati finanziari:
Analisi Ciclica (Tempo)
Analisi Tecnica (Prezzo)
Volumi
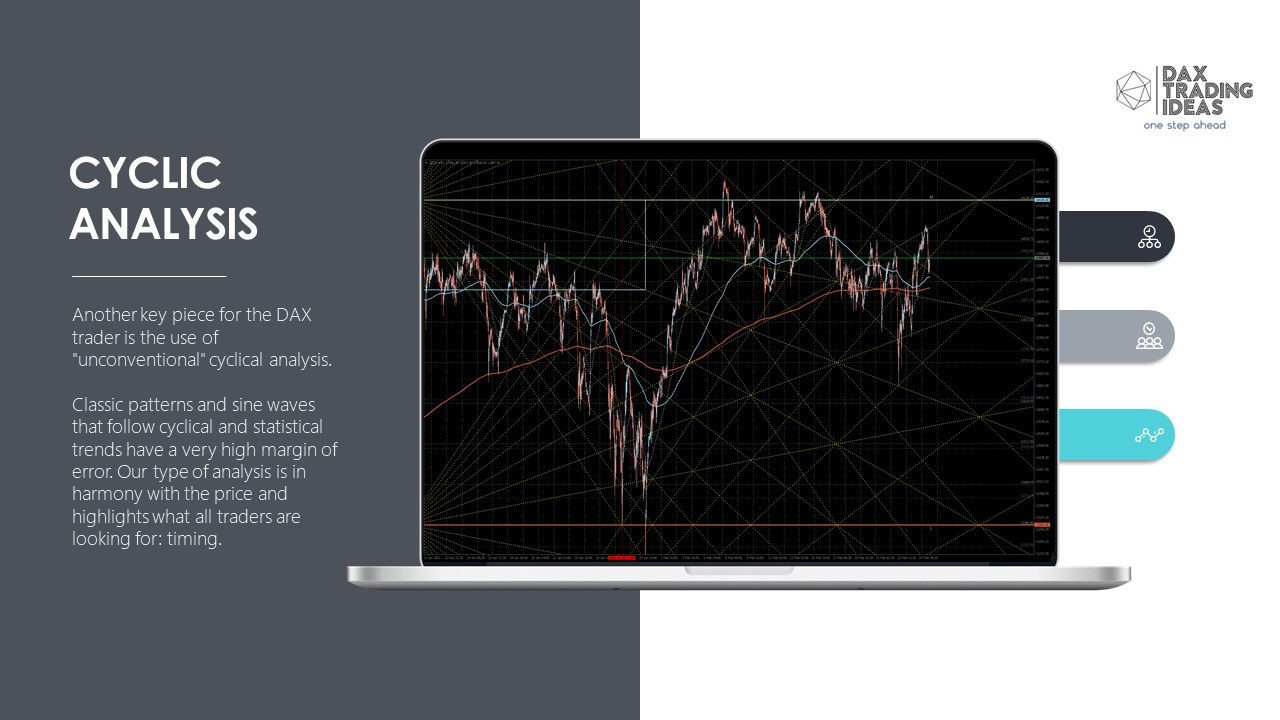
UNCONVENTIONAL CYCLIC ANALYSIS (Time Factor)
Over the years many studies on cyclicality of the market have been addressed, with various approaches. Gann, Hurst, Elliott among the most important, have tried to identify missing link to the pure price analysis, namely time. Without entering into technicalities that would send the purists of these types of analysis into a rage, we at Dax Trading Ideas have synthesized and simplified some concepts to make the analysis more concrete. What we need is the time reference: given a price range in a given time range, we can calculate future points where price can rightly vibrate. It is not magic, nor fiction, just mathematical relationships.
L’ANALISI CICLICA NON CONVENZIONALE (Fattore Tempo)
Negli anni molti studi sulle ciclicità del mercato sono stati affrontati, con vari approcci. Gann, Hurst, Elliott tra i più autorevoli, hanno cercato di identificare l’anello mancante all’analisi pura del prezzo, e cioè il tempo. Senza entrare in tecnicismi che manderebbero su tutte le furie i puristi di questi tipi di analisi, noi di Dax Trading Ideas abbiamo sintetizzato e semplificato alcuni concetti per rendere più concreta l’analisi. Quello di cui abbiamo bisogno è il riferimento temporale: dato un range di prezzo in un dato un range di tempo, riusciamo a calcolare i punti futuri dove il prezzo a ragion veduta possa vibrare. Non è magia, né finzione, soltanto rapporti matematici.
TECHNICAL ANALYSIS
Let's start with the denigrated technical analysis: I enjoy so much to see so many people on social networks picking on TA. Sometimes I agree: improvised traders draw really brilliant scribbles on charts, but they have nothing to do with TA. I also don't like to use book names for patterns, or give a particular name to a candle or bar. Sometimes when we get too complicated I use this method: «Back To Basis». That is, I remove everything from the chart, and I realize how clear everything was without all those little lines I drew. This is what we have to do when approaching TA: take the useful references, necessary to understand what happened and what could happen in the future. Remember that market, in particular DAX «has historical memory» of the levels. So we have to use the chart as if it were the notepad, the notebook where we «mark, trace» what happened. Even writing on the chart on that given day there was a macro announcement, we can note the effect of that exogenous news and what it has caused on that market.
Furthermore we must add that over time technical analysis has evolved a lot and has been integrated with statistical/quantitative analysis. For this reason I say that it is not all to throw away, on the contrary!
L’ANALISI TECNICA
Partiamo dalla tanta denigrata analisi tecnica: nei social mi diverto tantissimo a vedere tanti prendersela con l’AT. Alcune volte sono d’accordo: i traders improvvisati disegnano degli scarabocchi sui grafici veramente geniali, ma che non hanno nulla a che fare con l’AT. Non mi piace neanche utilizzare i nomi da libro dei pattern, o affibbiare un nome particolare ad una candela o una barra. Alcune volte quando ci complichiamo troppo la vita utilizzo questo metodo: «Back To Basis». Cioè tolgo tutto dal grafico, e mi accorgo di quanto era tutto molto chiaro senza tutte quelle lineette che ho disegnato. Cosi dobbiamo fare anche approcciando l’AT: prendere i riferimenti utili, necessari per capire cosa è successo e cosa potrebbe succedere in futuro. Ricordiamo che il mercato, in particolare il DAX «ha memoria storica» dei livelli. Quindi dobbiamo utilizzare il grafico come se fosse il blocco note, il libretto degli appunti dove «segnare, tracciare» quello che è accaduto. Anche scrivere sul chart che in quel dato giorno c’è stato un annuncio macro, possiamo notare l’effetto di quella notizia esogena e quella che ha provocato su quel mercato.
Inoltre dobbiamo aggiungere che nel corso del tempo l’analisi tecnica si è evoluta tantissimo e si è integrata tantissimo con l’analisi statistica/quantitativa. Per questo io dico che non è tutto da buttare, anzi!
VOLUMES
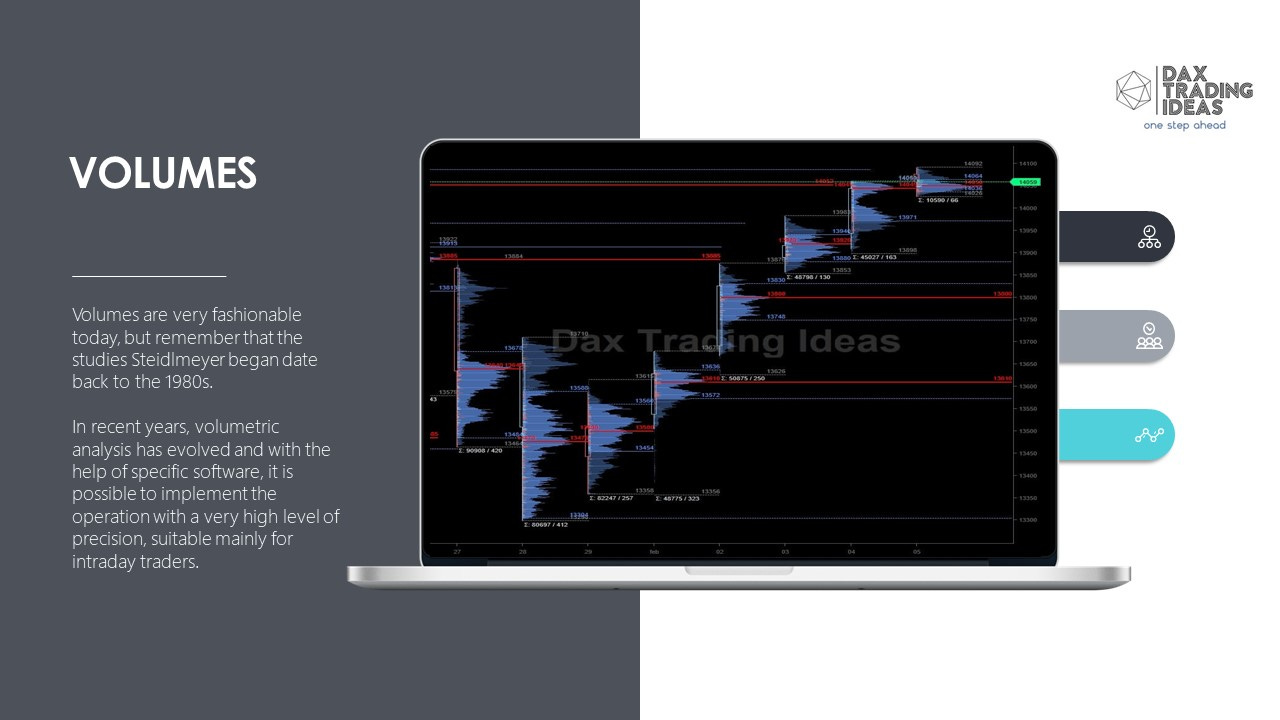
The volumetric analysis is another very important element in our opinion. From my experience I can testify technical levels and unconventional analysis that we do at Dax Trading Ideas are confirmed by the volumes. Let me explain better: on a given price level we have identified for any reason and consider important, we note confluence of many trades and therefore many volumes on that level. The question arises spontaneously, and it has been a point of reflection that I have carried with me for many years: was the egg born first or the chicken? In this case: was the level born first or the volume first? I can confirm that after years and years of studying the DAX in great depth, level came first. In the sense, price-time level was already there and carved into the chart, when market arrived there, it had a reaction and attracted buyers and sellers «for some reason», who flowed their money on that level, expressing volume on the chart. I could get a lot of criticism for this statement but I allowed myself to make it because time and study gave me this answer, I speak for knowledge of the facts. Do I denigrate volumes? Far from it. For intraday analysis, observation of volumetric flow, with delta volume, mirror profile, volume profile and other tools and with specific software, I can assure that it is an absolutely clear map of what happened. Therefore having the volumes can be very important to map the levels before entering the market.
I VOLUMI
L’analisi volumetrica è un altro tassello a nostro parere molto importante. Dalla mia esperienza posso testimoniare che i livelli tecnici e le analisi non convenzionali che effettuiamo noi di Dax Trading Ideas vengono confermate dai volumi. Mi spiego meglio: su un dato livello di prezzo che abbiamo identificato per un qualsiasi motivo e che riteniamo importante, notiamo la confluenza di molti scambi e quindi tanti volumi su quel livello. La domanda sorge spontanea, ed è stato uno spunto di riflessione che mi sono portato dietro per tanti anni: è nato prima l’uovo o la gallina? In questo caso: è nato prima il livello o prima il volume? Posso confermare dopo anni e anni di studio sul DAX molto approfondito è nato prima il livello. Nel senso, quel livello di prezzo-tempo era già li presente e scolpito all’interno del grafico, quando il mercato è arrivato li ha avuto una reazione ha attratto «per qualche motivo» compratori e venditori che sul quel dato livello hanno confluito i loro soldi, esprimendo volume sul chart. Potrei attirarmi molte critiche per quest’affermazione ma mi sono permesso di farla perché il tempo e lo studio profuso mi ha dato questa risposta, parlo per cognizione di causa. Allora denigro i volumi? Tutt’altro. Per l’analisi intraday, l’osservazione del flusso volumetrico, con il delta volume, il mirror profile, il volume profile e altri strumenti e con software specifici, posso assicurare che è una mappa assolutamente chiara di quello che è successo. Pertanto avere i volumi può essere molto importante per mappare i livelli prima di entrare a mercato.


